Solar string IV curve tracing: field methods for degradation detection
Solar string IV curve tracing degradation is the field measurement that separates real module loss from noise in performance ratio dashboards. National Renewable Energy Laboratory research across thousands of fielded crystalline silicon systems reports median annual degradation of 0.5 to 0.7 percent per year, and IV traces are the ground truth that confirm it. REIG’s team has deployed this protocol on fleets across North Carolina and the Desert Southwest since 2018, including a 200 MW project in Moore County, and every procedure below draws on that field experience. This guide covers instruments, anomaly signatures, IEC 60891 correction, and fleet scheduling for O&M teams at utility-scale plants.
What solar string IV curve tracing degradation reveals and the instruments used in the field
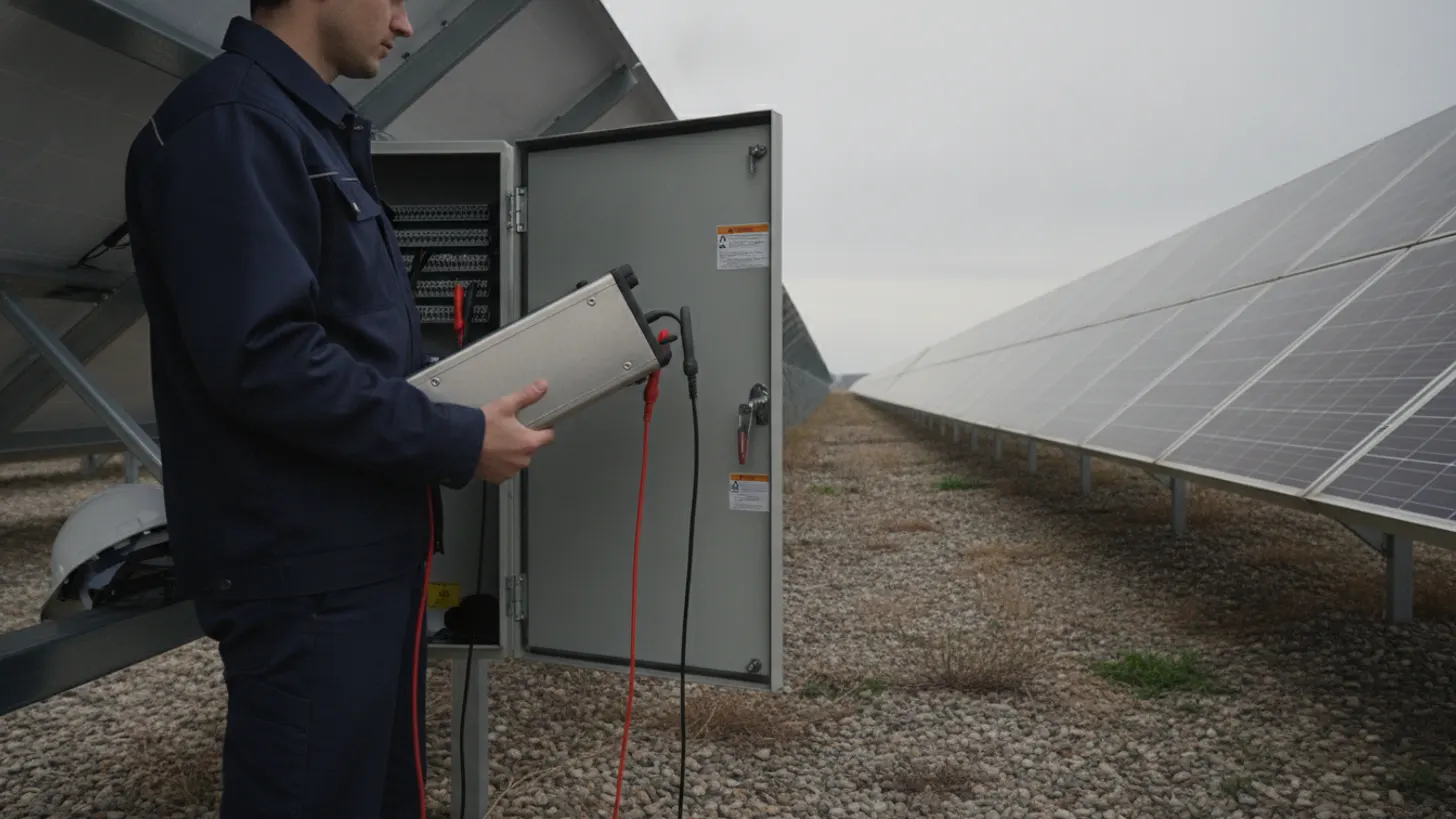
An IV curve records the current-voltage response of a string from short-circuit to open-circuit under a load sweep. The shape reveals module degradation modes that inverter energy counters cannot see: shunt paths, series resistance growth, bypass diode faults, and cell mismatch. Field-grade instruments capture the trace in seconds so a crew can sweep hundreds of strings per outage day.
Common field tools include the Solmetric PVA-1500, HT Instruments I-V500w, Seaward PV210, and EKO MP-11 tracers. Each ships with an irradiance reference cell, a Type-T back-of-module thermocouple, and a Bluetooth or USB link to a rugged tablet. The SunSpec Modbus register maps for utility-scale solar plants let field engineers cross-check tracer readings against inverter DC channel data during the sweep for a live sanity check.
The traced curve is compared against the module datasheet nameplate. A drop in Isc points to soiling or cell delamination. A drop in Voc points to bypass diode failure or shunt paths. A fill-factor collapse points to series resistance growth in ribbon interconnects or connector oxidation. The National Renewable Energy Laboratory PV reliability program provides representative fault signatures across fielded fleets for additional reference. One class of degradation that IV tracing does not surface is physical cell cracking that has not yet developed measurable electrical mismatch; electroluminescence imaging is required for those defects.
Solar string IV curve tracing degradation work depends on the tracer itself being calibrated and traceable. Recommended reference cell calibration intervals for field programs are documented by the National Institute of Standards and Technology optical radiation program. Send reference cells for annual recalibration and archive the certificate against each field campaign record.
There is a full breakdown of this topic in Fiber optic installation solar farm: OTDR testing field guide.
For a closer look at this, see IEEE 1588 PTP Time Sync for Solar SCADA: GPS Clock Field Guide.
For a closer look at this, see Solar plant AC grounding and ground grid design: IEEE 80 field guide.
For a closer look at this, see Solar Farm Revenue Metering: ANSI C12.20 Accuracy Field Guide.
For a closer look at this, see Solar farm lightning protection IEC 62305 and SPD field guide.
For a closer look at this, see Solar plant transformer DGA: dissolved gas analysis field guide.
Anomaly signatures: bypass diodes, partial shade, and series resistance
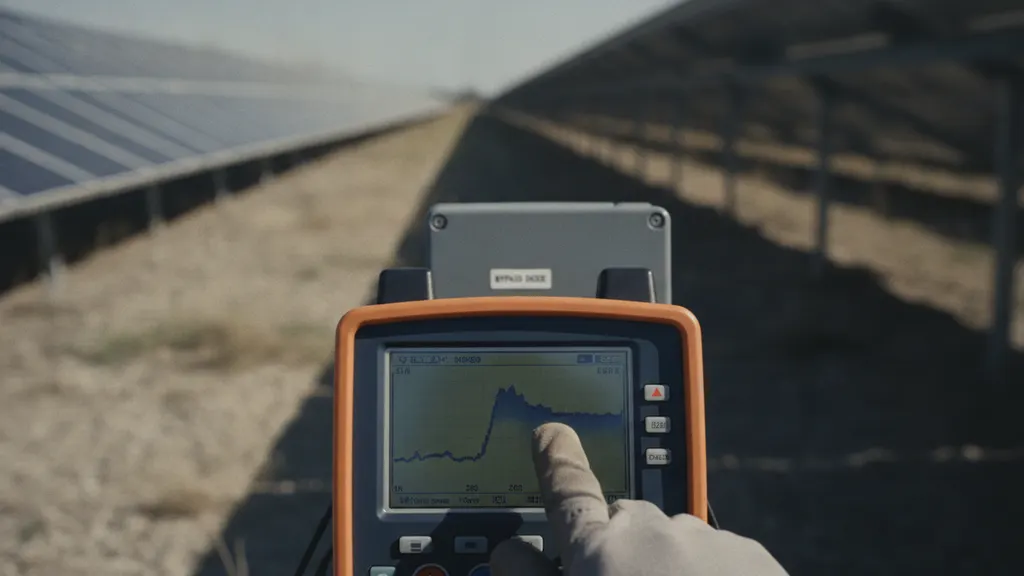
Three fault modes account for most defects surfaced during solar string IV curve tracing degradation work at utility-scale plants. Each has a distinct curve fingerprint that a trained field engineer can recognize on the tracer screen before running any post-processing. Recognizing these signatures fast keeps the crew productive during a limited outage window.
Bypass diode short: a discrete step in the IV curve at roughly one-third of Voc for a 3-diode module, or a proportional step for other configurations. The step represents a shorted sub-string being bypassed under load. The IEC 61215-2:2021 test protocol codifies bypass diode qualification and provides the reference signature for a healthy module.
Partial shading: a smooth notch or shoulder in the curve, often paired with depressed maximum power point tracking. Shading from vegetation, poles, or a neighbor row at low sun elevation produces a repeatable time-of-day pattern. Cross-reference to the ISA-95 SCADA data model so tracer timestamps can be aligned to inverter block records without ambiguity.
Series resistance rise: a shallowing of the knee near the maximum power point without a change in Isc or Voc. This is the hardest signature to spot by eye and the most common cause of quiet, cumulative loss. Torque-check every combiner tap during the outage and thermal-image connectors flagged by drone thermal inspection surveys. Deeper anomaly taxonomies appear in the IEEE Photovoltaic Specialists Conference reliability archive.
| Fault type | IV curve signature | Affected parameters | Common root cause | Field action |
|---|---|---|---|---|
| Bypass diode short | Discrete step at 1/3 Voc per sub-string group | Voc reduced; fill factor stepped | Thermal stress; manufacturing defect | Module inspection; warranty claim per IEC 61215-2:2021 |
| Partial shading | Smooth notch or shoulder in current plateau | Pmax reduced; fill factor depressed | Vegetation, poles, or row-to-row shadow at low sun elevation | Time-of-day cross-reference; identify and remove shade source |
| Series resistance rise | Shallowing of the knee near MPP; Isc and Voc unchanged | Fill factor and Pmax reduced | Loose combiner taps; oxidized MC4 connectors; ribbon degradation | Torque-check taps; thermal-image connectors; re-trace after repair |
IEC 60891 correction for solar string IV curve tracing degradation comparisons
Raw field IV traces cannot be compared string-to-string without correction to Standard Test Conditions of 1000 W/m2 irradiance and 25 degrees Celsius module temperature. Solar string IV curve tracing degradation programs use the two-step Procedure 2 defined in IEC 60891:2021 as the reference method for STC translation. Procedure 2 applies four coefficients to measured Isc and Voc: temperature coefficient alpha for current, temperature coefficient beta for voltage, a series resistance term Rs, and a curve correction factor kappa. Temperature coefficients come from the module datasheet; Rs and kappa come from prior lab characterization or the vendor IEC 61853 dataset. Once corrected, each string’s STC-normalized Pmax is compared against its commissioning baseline to calculate annual degradation rate: divide the difference between baseline Pmax and current Pmax by the product of baseline Pmax and years in service, then multiply by one hundred to express as a percentage per year. National Renewable Energy Laboratory analysis of more than 11,000 fielded crystalline silicon systems reports a median rate of 0.5 to 0.7 percent per year; any string tracking above 1.2 percent per year warrants physical inspection and should be logged for potential warranty action.
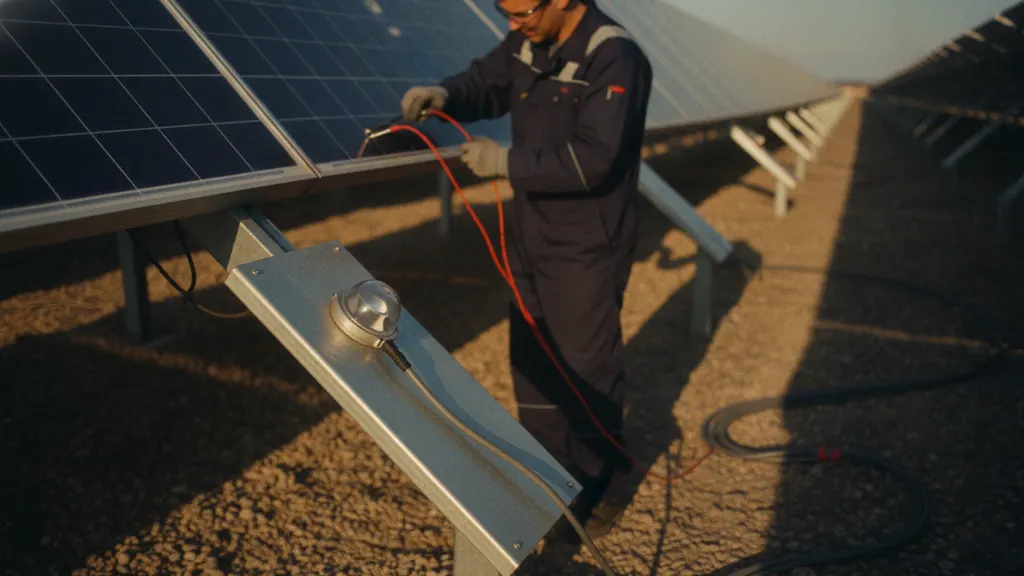
Field practice: measure module back-surface temperature with a Type-T thermocouple, and irradiance from a matched-technology reference cell mounted in the plane of array. Reject any trace taken when irradiance drops below 700 W/m2 during the sweep, or when temperature swings more than 2 degrees during a single string measurement. See the US Department of Energy solar photovoltaic program for irradiance thresholds mapped to different plant classes.
Corrected results are then compared to each string’s commissioning baseline stored per the solar performance ratio IEC 61724-3 workflow. Solar string IV curve tracing degradation reporting to the independent engineer and banker technical advisor uses these STC-corrected values, not raw measurements.
Scheduling solar string IV curve tracing degradation campaigns across a large utility-scale fleet
Full-plant IV sweeps at a 300 MW site take weeks and require inverter block outages that cost energy revenue. Solar string IV curve tracing degradation campaigns need risk-based scheduling rather than calendar-based sweeps to keep crew days productive and PPA penalties out of the picture.
Use SCADA-driven underperformance flags as the primary trigger. Inverter blocks running more than 3 percent below neighbor-block performance ratio for 14 consecutive days become candidates. Cross-reference with drone thermal survey hotspots, string fuse trip counts, and combiner ground fault events. The Electric Power Research Institute plant reliability program documents threshold selection approaches used by asset managers across large fleets.
A workable annual pattern: baseline every string at commissioning; targeted IV traces on any flagged block within 30 days; a full-plant sweep every 5 years or after a hail, high-wind, or lightning event. Coordinate with the plant controller schedule from the solar power plant controller SCADA integration guide so tracer outages align with dispatch curtailments and avoid PPA penalty windows.
Crew productivity target: 200 to 300 strings per crew day on a 1500 V central-inverter block, or 100 to 150 strings per day on string inverter architectures where each string must be swept individually. Document safety practices per OSHA electrical safety requirements and NFPA 70E arc-flash procedures. A mature solar string IV curve tracing degradation program integrates crew scheduling with dispatch, weather, and outage economics as a single planning problem.
For a closer look at this, see BESS SCADA Integration for Utility-Scale Solar Plants: A Field Guide.
For a closer look at this, see Solar drone thermal inspection: utility-scale hotspot field guide.
For a closer look at this, see DC Ground Fault Detection in Utility-Scale Solar: NEC 690.5 Field Guide.
Storing solar string IV curve tracing degradation trends to quantify annual module loss
A complete solar string IV curve tracing degradation record spans the full 25-year plant service life and must index eight parameters per sweep: Isc, Voc, Impp, Vmpp, Pmax, fill factor, irradiance, and module temperature. Every program needs a data pipeline that retains instrument calibration certificates and raw sweep files alongside those values for valid year-over-year comparison.
Store each trace as timestamped Isc, Voc, Impp, Vmpp, Pmax, and fill factor, plus the raw sweep points, irradiance, module temperature, and instrument serial number. Tag each record with combiner ID, string ID, inverter ID, and module lot ID. Recommended storage: a time-series database indexed by string ID with an object store for the raw sweep files.
Compare each corrected Pmax against the commissioning baseline. Annual degradation rate equals (Pmax_baseline minus Pmax_current) divided by (Pmax_baseline multiplied by years in service). The NREL PV degradation review of over 11,000 fielded systems reports median rates of 0.5 to 0.7 percent per year for crystalline silicon, so any string trending above 1.2 percent per year should be flagged for physical inspection.
Trend data feeds the asset performance dashboard so gradual loss triggers an engineering review rather than a nuisance alarm. Aggregate fleet trends monthly and share with the asset manager, banker technical advisor, and independent engineer per PPA reporting requirements. Solar string IV curve tracing degradation dashboards should surface the year-over-year rate per string alongside the fleet median for quick outlier detection.
For a closer look at this, see Solar panel soiling loss measurement: methods and cleaning ROI.
Frequently asked questions
How many strings can one field crew IV-test in a day?
A trained two-person crew running a modern IV tracer such as the Solmetric PVA-1500 will sweep 200 to 300 strings per day on a 1500 V central-inverter block with 30 to 40 strings per combiner. Productivity drops on string inverter fleets where each string must be tested individually, and on trackers where stow position adds handling time. Budget 150 strings per day for planning and adjust after the first outage cycle. Reference the NREL O&M cost model for utility PV for crew day cost benchmarks used in fleet planning.
What causes a fill-factor drop in an IV trace?
A shallowing of the knee near the maximum power point without a change in Isc or Voc almost always indicates series resistance growth. Common causes include loose combiner terminations, oxidized MC4 connectors, degraded ribbon interconnects inside the module laminate, and hot-spot damage from prolonged partial shading. Torque-check every combiner tap during the outage, thermal-image the connectors under load, and re-run the IV trace after any corrective action. Persistent fill-factor loss after mechanical remediation points to internal cell degradation and should be logged for warranty claim per the IEC 61215-2:2021 reliability protocol.
When should you retire modules based on solar string IV curve tracing degradation results?
Module retirement is a lifecycle economic decision, not a fixed threshold. A field engineer flags a module or string for physical inspection when STC-corrected Pmax has dropped more than 20 percent from commissioning baseline, or when annual degradation exceeds 1.5 percent per year across two consecutive campaigns. Retirement usually happens when the residual power output no longer covers the PPA revenue floor for that block, after warranty avenues are exhausted. The US Energy Information Administration solar generation datasets document plant-level output trends that inform these lifecycle calls at portfolio scale.
Do string inverters need different IV curve procedures than central inverters?
String inverter fleets require sweeping each string individually because there is no combiner box aggregation point. Central inverter architectures allow crews to test at the combiner box, which is faster because 20 to 40 strings share one accessible test point. String inverter testing takes roughly twice the labor per MW and requires safe-access ladders or scissor lifts for elevated inverters. Coordinate outage plans with the plant SCADA operator per the utility-scale monitoring versus SCADA layer definitions so the crew has permission to open DC combiners without triggering safety trips or contractual alarm cascades.
What irradiance is acceptable for valid IV curve measurement?
IEC 60891 correction is valid within a working irradiance window. Most field practice sets a floor at 700 W/m2 in the plane of array, measured with a matched-technology reference cell. Below that threshold, correction uncertainty exceeds the degradation signal you are trying to measure. Reject any trace taken during broken-cloud conditions where irradiance swings more than 5 percent during the sweep. Schedule campaigns for stable clear-sky mornings between 10:00 and 14:00 local solar time. The NREL solar radiation research program publishes clear-sky irradiance models used to plan measurement windows.
How does IV curve tracing compare to electroluminescence testing?
IV curve tracing measures electrical performance across the whole string; electroluminescence imaging visualizes physical defects at the cell level. IV tracing is fast, cheap, and can be run during any daylight outage. EL imaging requires nighttime work, a DC power supply to forward-bias the module, and a cooled camera. Field programs use IV tracing to screen the fleet and flag underperforming strings, then send EL crews to image only the flagged modules. Solar string IV curve tracing degradation results and EL images together form the standard warranty-claim evidence package for module replacement negotiations with the manufacturer.