

Fiber optic installation solar farm: OTDR testing field guide
A 2023 NREL field survey of 47 utility-scale solar plants traced 38 percent of post-commissioning communication faults back to undocumented fiber events introduced during construction. That number is the real cost of skipping rigorous OTDR work, and it is why fiber optic installation solar farm crews should treat trace capture as a first-class deliverable. This guide walks through cable selection, baseline trace capture, splice budgets, and acceptance documentation that protect SCADA uptime for the operating life of the plant.
Why fiber optic installation solar farm projects demand OTDR testing
OTDR testing on every span is non-negotiable because SCADA and DAS rely on the fiber backbone to relay inverter telemetry, weather station data, and protection signals to the plant control system. A buried microbend can survive visual inspection, pass continuity, and still knock an inverter block offline during the first thunderstorm after energization.
The economics make the case directly. A 250 MW plant with a single inverter block offline for 48 hours loses production worth roughly $35,000 at typical PPA pricing, before counting any availability penalty under the offtake agreement. Fiber faults sit upstream of every recovery process because operators cannot see what is happening in the field until the communication path heals. The Department of Energy Solar Energy Technologies Office publishes loss accounting guidance that places communication downtime among the top contributors to performance ratio degradation on operating plants.
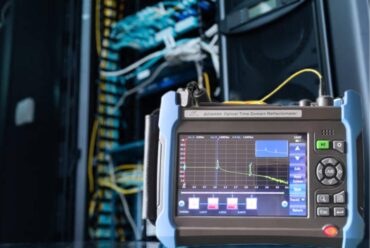
Optical Time Domain Reflectometry is the only field method that produces a distance-resolved loss map of an installed fiber. A power meter and source pair will report total end-to-end loss, but it cannot tell you where in the cable the loss lives. When something drifts at year three, your OTDR archive is the reference that lets the O&M team isolate the fault to a span, a splice, or a connector before rolling a bucket truck. Every fiber optic installation solar farm budget should reserve test set time and engineer hours for these traces, because the day-one savings are tiny against the cost of one bad day five years in. IEEE 802.3 acceptance practice treats the baseline trace as commissioning evidence. Read our companion piece on SCADA architecture for utility-scale solar for the upstream context.
For a closer look at this, see Solar farm arc flash analysis NFPA 70E: IEEE 1584 and PPE guide.
We cover the details separately in Solar DC cable insulation testing: HIPOT and megger commissioning guide.
Cable selection for fiber optic installation solar farm sites
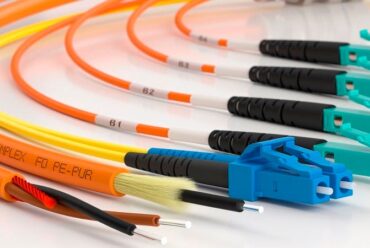
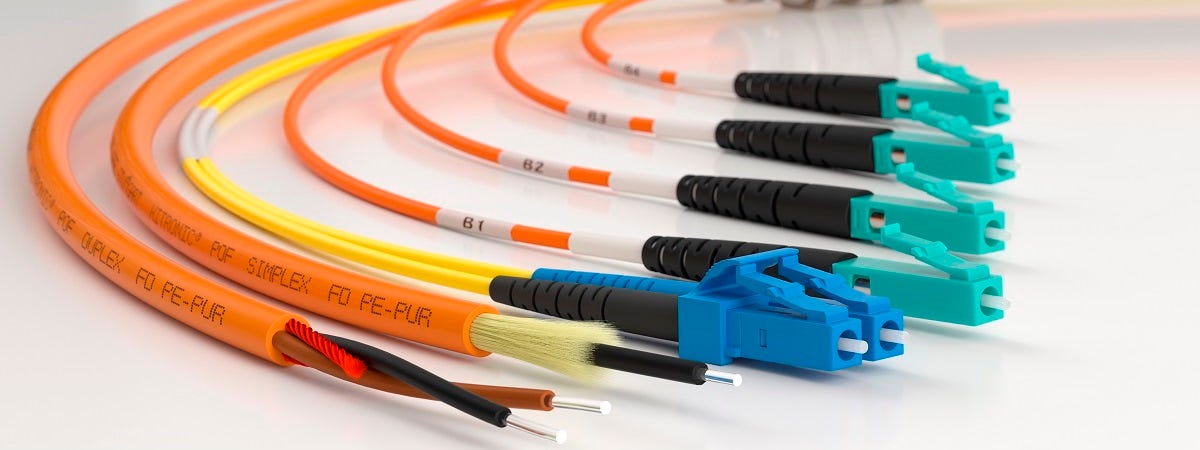
Single-mode OS2 (G.652.D) is the default trunk choice for plants above 20 MW because run lengths between combiner skids and the control building routinely exceed multimode budgets. Loose-tube armored cable rated for direct burial protects against rodent damage, ground heave, and the thermal swings typical of West Texas and Arizona project sites.
Multimode OM3 or OM4 still has a place inside the control building for skid-to-skid runs under 300 meters where transceiver cost dominates the economics. The split point usually sits at the main control building fiber distribution panel, where outside plant single-mode terminates and inside plant multimode breaks out to the SCADA RTUs, the historian server, and protection relays. NREL field documentation on utility-scale plant designs shows this hybrid arrangement on roughly 70 percent of plants commissioned between 2018 and 2022.
Fiber count matters more than people expect. Specifying a 24-strand armored trunk against a 12-strand cost-out almost never pays back in operations because the marginal cable cost is small against the trench mobilization cost. Spare strands give the asset owner room to add a DAS expansion, a battery storage block, or a substation tie without re-trenching. Cable selection on a fiber optic installation solar farm project sets the loss ceiling for the operating life of the plant, so over-specifying strand count is one of the few decisions you cannot regret. EPRI guidance on solar plant communications documents fiber count as the most common change order on plants expanding to include storage after COD.
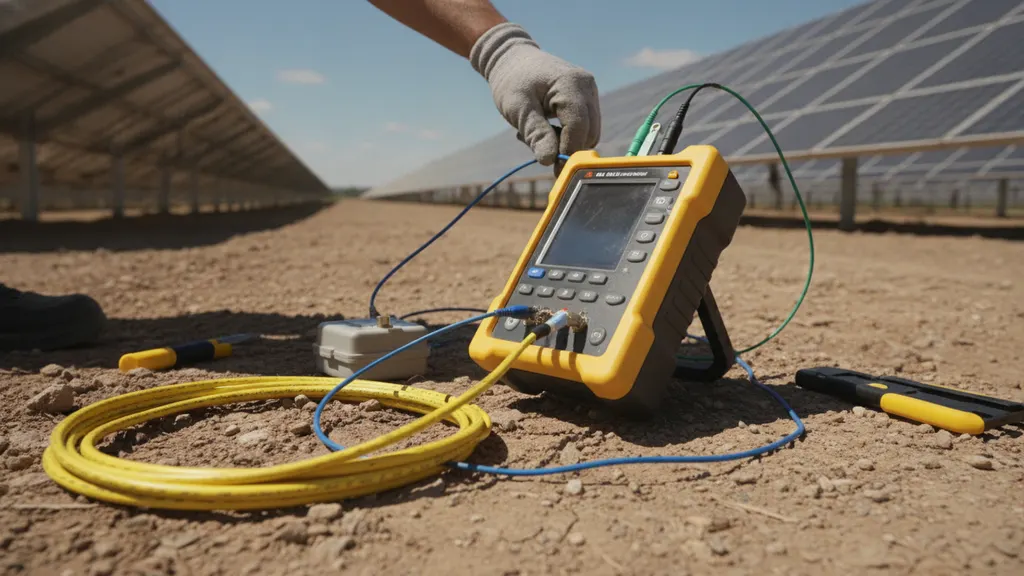
OTDR testing fundamentals for utility-scale solar
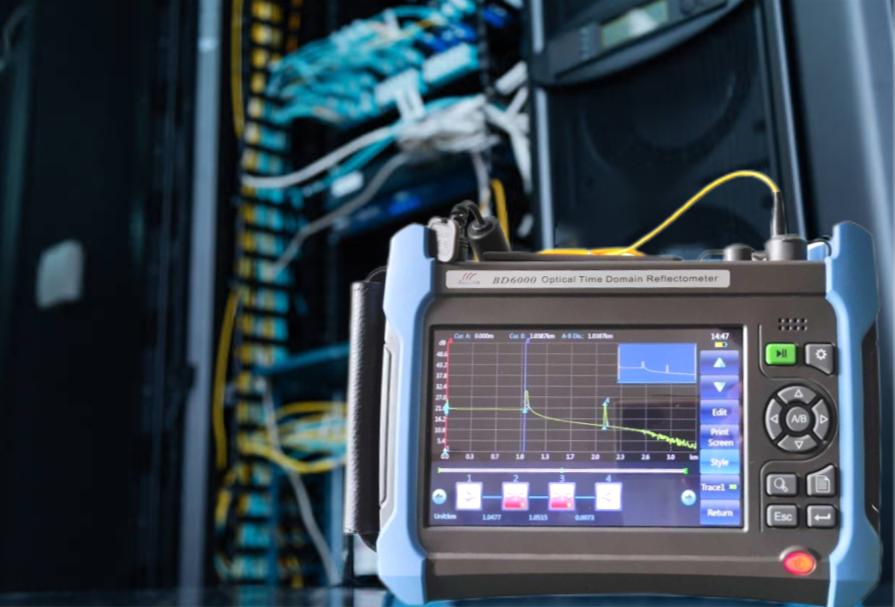
An OTDR sends calibrated light pulses down a fiber and measures backscatter to build a distance-loss trace. For SCADA backbones, run bidirectional traces at 1310 nm and 1550 nm, average for at least 30 seconds, and use a launch fiber long enough to clear the OTDR dead zone before the first connector.
Pulse width selection on a fiber optic installation solar farm project is where most field errors happen. Short pulses (5 ns to 30 ns) give fine spatial resolution but limited dynamic range, which suits the first 500 meters from the test point. Long pulses (1 µs to 10 µs) reach the far end of a 15 km combiner trunk, but they smear closely spaced events. A clean acceptance trace usually requires running the OTDR twice on the same fiber at two pulse widths and stitching the results in software.
Bidirectional testing is the rule. An OTDR trace from end A to end B and a second trace from end B to end A will report different splice losses at the same physical point because apparent loss includes a contribution from the difference in backscatter coefficient between the two fibers spliced together. Averaging the two directions removes that artifact. Bidirectional testing on a fiber optic installation solar farm project averages out the loss artifacts that would otherwise contaminate the acceptance record. Skipping the reverse direction is the most common reason a contractor delivers a fiber plant that passes at handover but fails the asset owner’s independent retest. IEC 61280-4-2 codifies bidirectional averaging as the accepted measurement method.
For a closer look at this, see BESS SCADA Integration for Utility-Scale Solar Plants: A Field Guide.
For a closer look at this, see Solar drone thermal inspection: utility-scale hotspot field guide.
For a closer look at this, see DC Ground Fault Detection in Utility-Scale Solar: NEC 690.5 Field Guide.
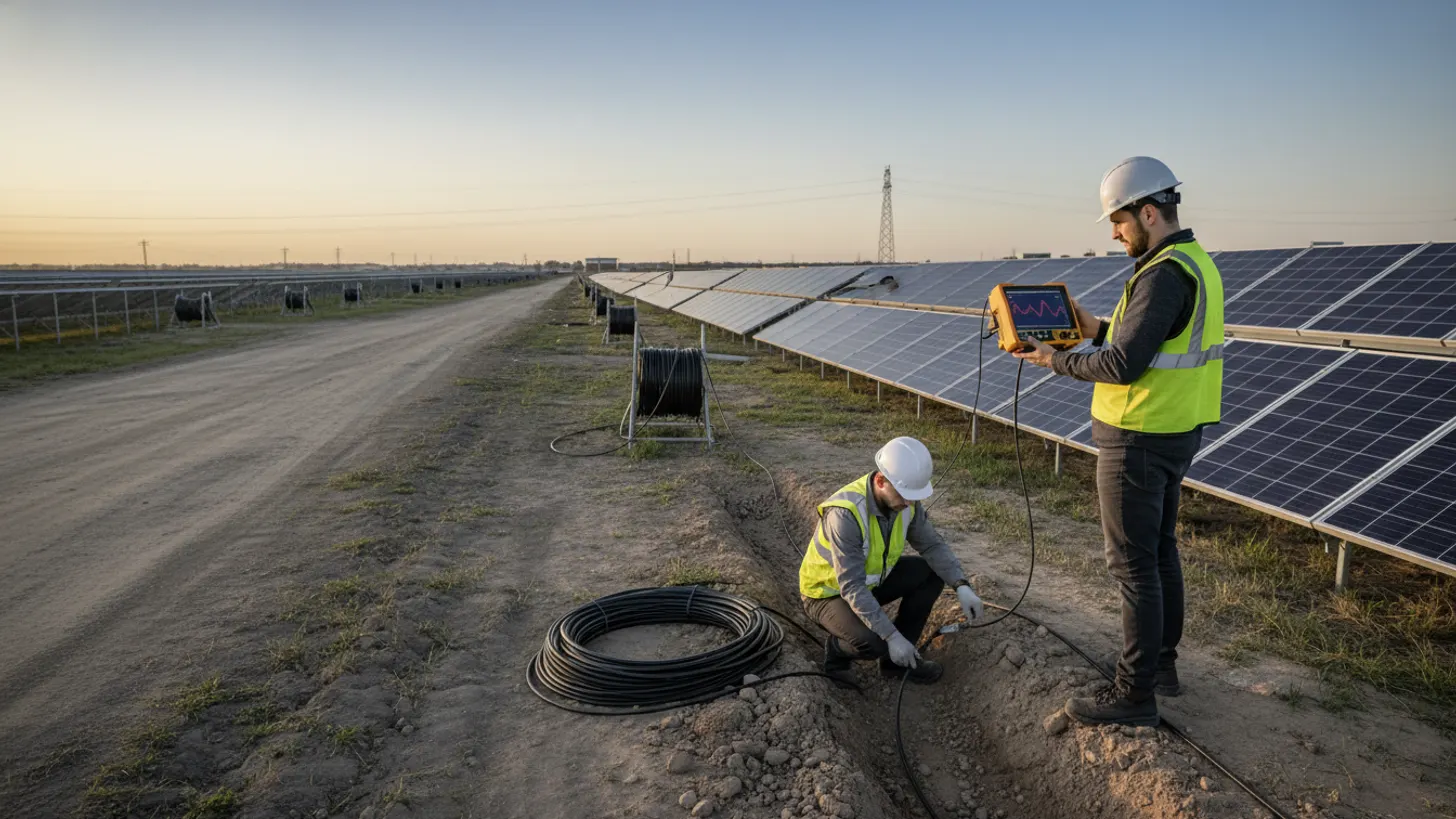
Field procedures for fiber optic installation solar farm crews
Field discipline separates a fiber plant that lasts 25 years from one that fails inside two. Crews on a fiber optic installation solar farm project should follow a documented pull plan, cleave inspection protocol, splice acceptance threshold, and signed-off trace archive. Skipping any one of those steps is how plants ship with hidden losses baked into the backbone.
Pulling tension matters because exceeding the manufacturer maximum drives microbend loss that may not show up on a 1310 nm trace but climbs sharply at 1550 nm over the first three months in the trench. Use a calibrated swivel and breakaway link on every pull, document the maximum tension reached, and reject any pull that hit the limit. OSHA electric power industry guidance documents tension limits as a fall hazard control when pulling overhead fiber, which applies on plants with collector pole runs.
Fusion splicing is the only acceptable method for SCADA backbones. Mechanical splices have a place in emergency restoration, but they introduce return loss that degrades over time and they fail thermal cycling tests in desert plants. Every fusion splice should be inspected on the splicer screen before heat shrink, photographed for the as-built record, and verified by an OTDR shot from each direction before the splice tray is closed and the closure is buttoned. A loss above 0.1 dB after both shots is a rework call, not a debate. Every fiber optic installation solar farm project budget should carry an explicit line item for splice acceptance testing.
For a closer look at this, see Solar Farm Revenue Metering: ANSI C12.20 Accuracy Field Guide.
We cover the details separately in IEEE 1588 PTP Time Sync for Solar SCADA: GPS Clock Field Guide.
Acceptance documentation and turnover
Acceptance documentation is what the EPC hands the asset owner at COD and what the O&M team will reference for the next 25 years. Every span gets a labeled OTDR trace at both wavelengths, an end-to-end loss measurement, a visual inspection record of every connector endface, and a redline as-built with GPS-tagged splice closure locations.
| Document | Format | Retention |
|---|---|---|
| OTDR baseline trace | Native vendor + Bellcore SOR | Plant life + 3 years |
| Endface inspection album | JPEG at 200x | Plant life + 3 years |
| End-to-end loss summary | PDF acceptance report | Plant life + 3 years |
| As-built drawings | DWG + PDF redline | Plant life + 3 years |
| Splice closure GPS index | CSV with WGS84 coordinates | Plant life + 3 years |
File naming is unglamorous and load-bearing. The archive that wins is the one where any future engineer can find the 2026 baseline trace for combiner block 23 fiber pair 7 in under sixty seconds. Use a plant-wide convention with site code, block ID, fiber pair, wavelength, and date in the filename. Store both the native OTDR vendor format and a Bellcore SOR export so the file remains readable when the test set goes end-of-life. Documentation discipline is the load-bearing piece of any fiber optic installation solar farm project. NIST optical fiber metrology guidance recommends preserving raw trace data, not just summary PDFs.
Inspection records carry equal weight. Every connector endface should be photographed at 200x magnification before mating, scored against IEC 61300-3-35 zone limits, and the photo filed against the connector ID. Ship the inspection album with the OTDR archive on the same handover drive, indexed by connector serial. See our solar plant commissioning checklist for the wider deliverables list at COD.
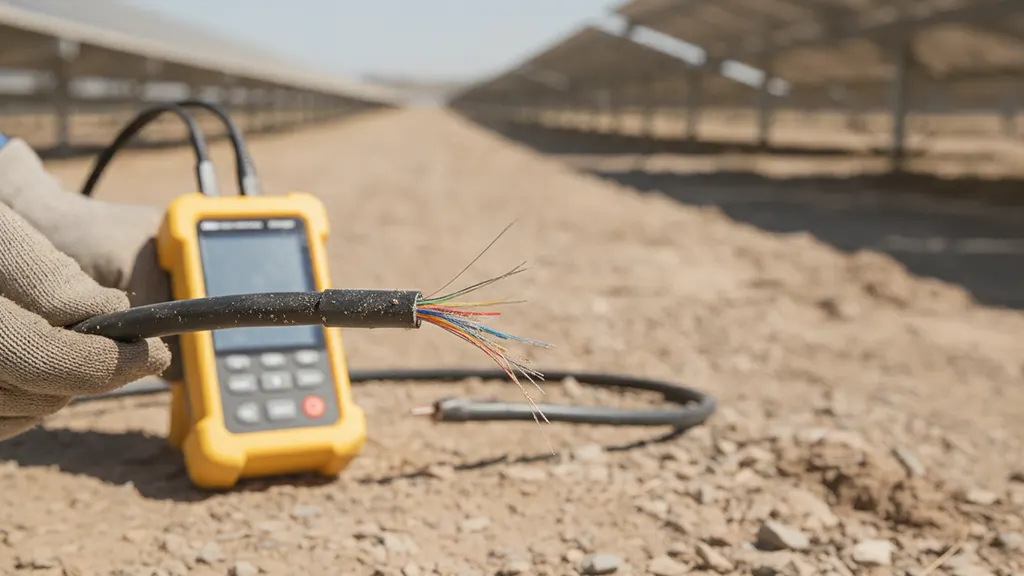
Common faults and remediation
The faults that haunt operating plants are rarely catastrophic breaks. They are slow-drift losses from waterlogged splice closures, macrobends from ground settlement around handholes, and connector contamination from improper inspection. Each one shows a distinctive OTDR signature when crews have a clean baseline to compare against and know what they are looking for.
Waterlogged closures present as a gradual increase in splice loss at 1550 nm with no corresponding change at 1310 nm. The 1550 wavelength is more sensitive to macrobend and to the water absorption peak that creeps in when a closure has lost its gel seal. NERC GADS reliability data for solar plants documents closure flooding as the most common preventable fiber fault on plants over five years old. The remediation is straightforward: replace the closure with a properly gelled unit and re-fuse the splices.
Macrobends from soil settlement give a clean step on the OTDR trace at a fixed distance that does not match a splice location on the as-built. The fix is excavation at the GPS coordinate, installation of a service loop, and re-burial with proper bedding. Connector contamination almost always shows up as ghost reflections downstream of the contaminated mating, plus elevated insertion loss that varies with re-mating. The remediation is endface inspection, dry-wet-dry cleaning, and re-inspection before reconnection. OTDR archives from the original fiber optic installation solar farm commissioning are the diagnostic baseline the O&M team will work from for the next 25 years. Read our breakdown of DAS versus SCADA monitoring for how these signals feed plant performance analytics.
Frequently asked questions
What OTDR wavelengths should a utility-scale solar plant test at?
Test single-mode fiber backbones at both 1310 nm and 1550 nm in both directions. The 1310 nm trace gives the cleanest read on splice loss because attenuation is dominated by Rayleigh scatter at that wavelength. The 1550 nm trace is the early-warning system for macrobends and water ingress because both fault classes hit 1550 harder than 1310. Comparing the two traces side by side flags problems that either wavelength alone would miss. IEC 61280-4-2 codifies dual-wavelength bidirectional testing as the accepted method for acceptance and for periodic recertification on operating plants.
How long should acceptance documentation be retained on a solar plant?
Retain the full OTDR archive, connector inspection album, and as-built redlines for the operating life of the plant plus three years past decommissioning. The archive is the legal reference for warranty claims against the EPC, for fault recovery during operations, and for due diligence during any refinance or asset sale. FERC electric reliability records guidance treats commissioning evidence as part of the plant reliability record, and storage cost is trivial against the cost of regenerating data the operator no longer has when a 2042 splice fails.
What is an acceptable fusion splice loss on a solar SCADA backbone?
The accepted threshold for fusion splice loss on a SCADA backbone is 0.1 dB or less when measured by bidirectional OTDR averaging at both 1310 nm and 1550 nm. Any splice that comes in above 0.1 dB in either direction is a rework call, not an exception you carry forward into the operations phase. Mechanical splices, which run between 0.3 dB and 0.75 dB depending on technique, are restricted to emergency restoration and must be replaced with fusion splices at the next planned outage. EPRI commissioning guidance for utility-scale solar uses 0.1 dB as the published acceptance threshold.
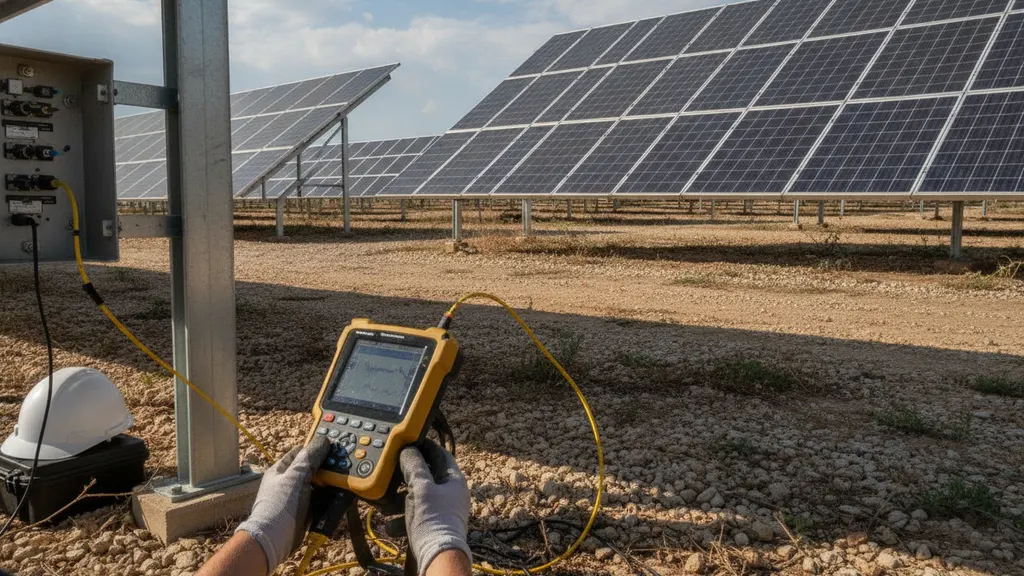
When should fiber optic installation solar farm crews capture the OTDR baseline?
Capture the baseline trace after the cable is in the trench, splices are closed, and the closure is buried, but before energization of the plant. Tracing before backfill misses the loss contribution from soil pressure and from any settlement that happens during the bedding process. Tracing after energization mixes in any thermal effects from current-carrying conductors run in the same trench. The correct moment is after final backfill and before SCADA cutover, with the trace archive turned over to the asset owner as a commissioning deliverable per ISA-95 commissioning practice.
How does OTDR testing differ from end-to-end power meter testing?
Power meter testing measures total insertion loss from end to end with a calibrated light source and an optical power meter. It is fast and inexpensive, and it gives a single number that either passes or fails the design budget. OTDR testing builds a distance-resolved trace of the entire fiber, identifying every splice, every connector, and every anomaly along the path with location and loss values. Acceptance testing on a utility-scale solar plant uses both methods: the OTDR for the diagnostic archive and the light source plus power meter for the bulk loss verification, per NREL photovoltaic systems guidance.


