
Utility Scale Solar Monitoring vs SCADA: Roles and Layers Defined
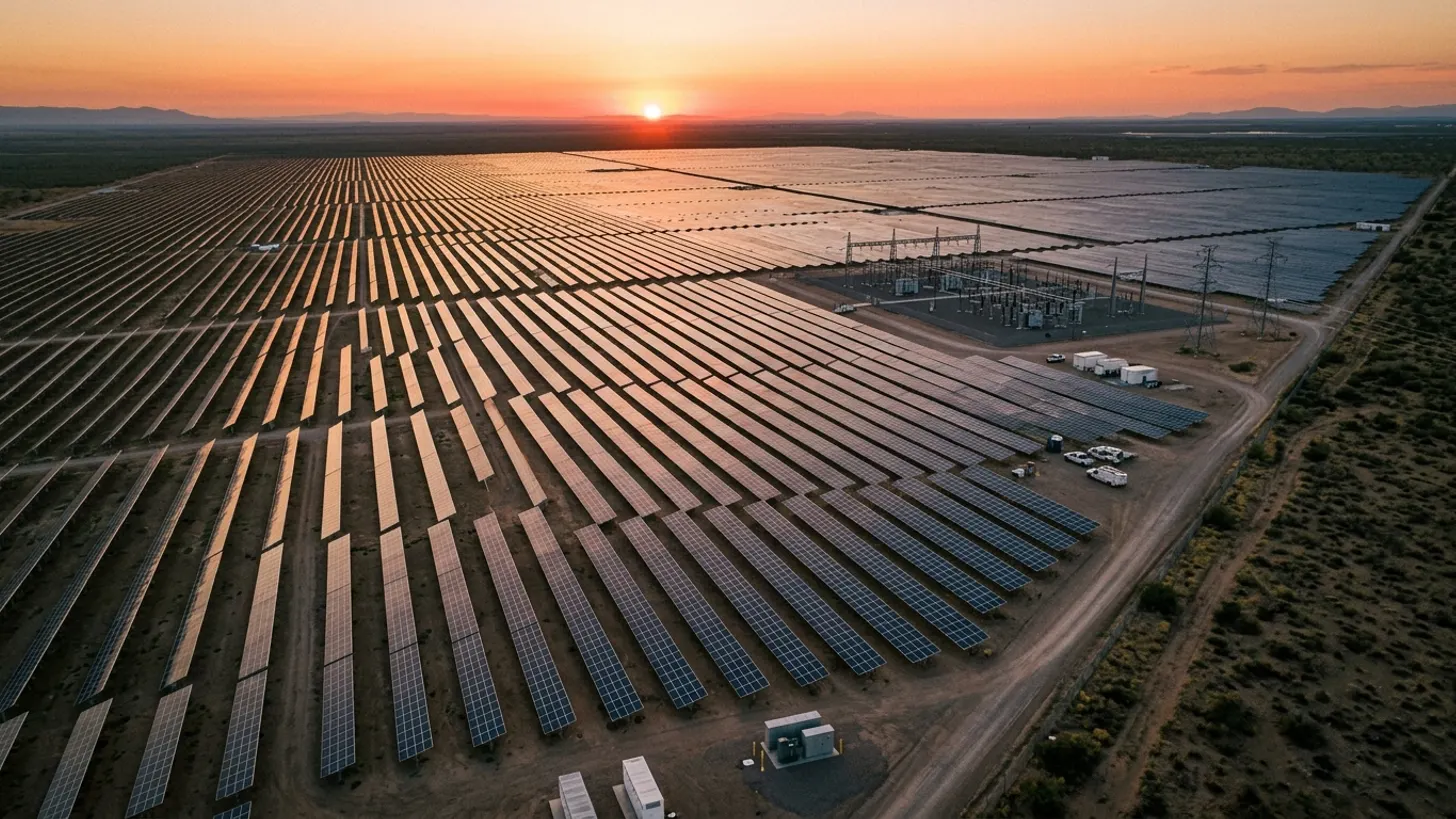
The United States added 32 GW of new solar capacity in 2024, with the U.S. Energy Information Administration projecting another 35 GW in 2026. Every plant inherits a control stack at substantial completion that the owner now has to operate. The phrase utility scale solar monitoring and the acronym SCADA describe different systems, though plant managers, EPCs, and lenders use them interchangeably during commissioning. The distinction shapes what data you collect, how inverters respond to grid signals, and what your O&M team can see at 2 a.m. when a string trips and the historian has no record.
What utility scale solar monitoring actually means
Utility scale solar monitoring is the data acquisition and visualization layer above the plant’s control systems. It pulls measured values from inverters, combiner boxes, transformers, meteorological stations, and the substation, then writes them to a historian for long-term analysis. The output feeds operator HMIs, owner dashboards, and the lender’s monthly availability report. The NREL utility-scale PV performance data report documents how disciplined instrumentation determines whether underperformance is caught in hours or weeks. Plants with thorough utility scale solar monitoring detect a string-level fault inside a day; plants relying on inverter portals alone often miss it for a billing cycle.
The monitoring layer does not control anything. Its job is to record what happened, calculate KPIs, and surface anomalies. When a string of modules clips early on a clear day, monitoring records the curve and flags the deviation; it does not write a setpoint to the inverter. That distinction matters during commissioning because it determines who signs off on which acceptance test and which contractor owns each fault. Treating monitoring as a write-back system also creates regulatory exposure during fault analysis. Auditors look for clear separation between the read-only record and the control surface.
We cover the details separately in Solar SCADA Alarm Rules: Cut Nuisance Noise on Utility-Scale Plants.
For a closer look at this, see Solar SCADA commissioning: building the utility witness pack.
There is a full breakdown of this topic in SunSpec Modbus inverter: register maps for utility-scale solar plants.
For a closer look at this, see Solar SCADA cybersecurity NERC CIP: utility-scale compliance guide.
We cover the details separately in Solar tracker SCADA integration: backtracking and tag map design.
We cover the details separately in BESS SCADA Integration for Utility-Scale Solar Plants: A Field Guide.
We cover the details separately in Modbus TCP vs DNP3: solar SCADA protocol guide for utility plants.
There is a full breakdown of this topic in IEEE 1588 PTP Time Sync for Solar SCADA: GPS Clock Field Guide.
There is a full breakdown of this topic in Solar drone thermal inspection: utility-scale hotspot field guide.
There is a full breakdown of this topic in DC Ground Fault Detection in Utility-Scale Solar: NEC 690.5 Field Guide.
SCADA vs monitoring: the operational difference
SCADA (Supervisory Control and Data Acquisition) is the control bus. It writes setpoints, opens and closes breakers, acknowledges alarms, and enforces interlocks between equipment. Monitoring is the read-only sibling. On most plants, both systems pull data from the same RTUs and PLCs, but only SCADA can issue commands back. The ISA-99 / IEC 62443 industrial security framework treats the two as separate zones with strict conduit rules between them, which is why a properly architected plant routes monitoring traffic through a unidirectional gateway when the historian sits in a corporate network.
The operational difference shows up in incident response. When the substation breaker trips, the SCADA operator sees the alarm in 200 milliseconds, executes the reclose if conditions allow, and logs the event. The monitoring dashboard catches up seconds later and rolls the event into the daily availability report. If you ask the monitoring system to perform the reclose, you have built a tightly coupled system that fails the IEEE 1547-2018 interconnection standards on response time. For deeper architectural detail, see our note on SCADA system design best practices. Keep the responsibilities separate during design, not after the first audit.

The DAS layer inside utility scale solar monitoring
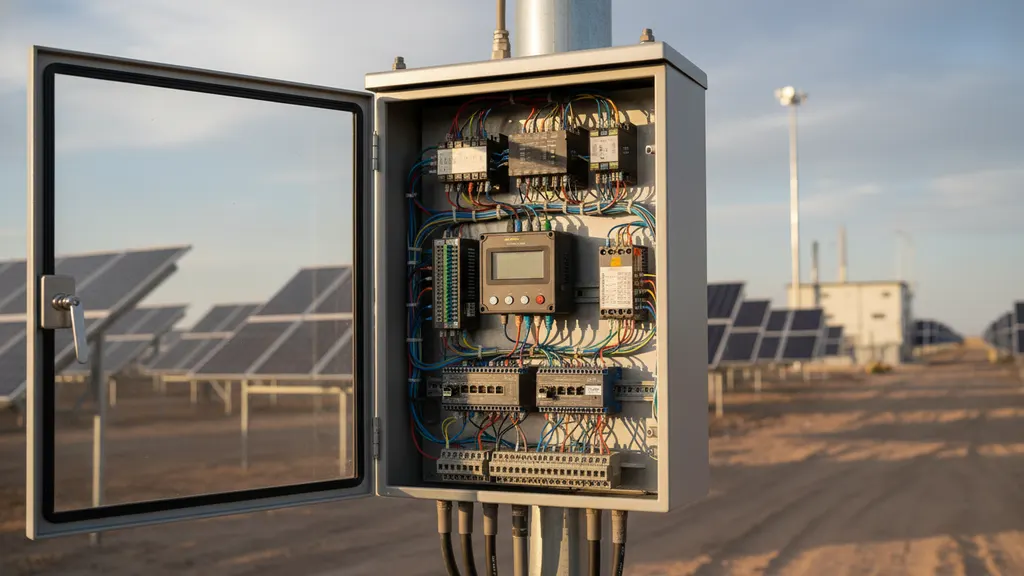
DAS (Data Acquisition System) is the layer that actually talks to the field devices. Inside utility scale solar monitoring, the DAS handles protocol translation, time-stamping, and store-and-forward when the WAN link drops. It typically lives on a hardened gateway at the plant, often a Campbell Scientific CR1000X, a SEL RTAC, or a Siemens Ruggedcom RX1500 running a custom polling profile. The gateway is what survives the storm; everything upstream is replaceable.
A well-built DAS for a 100 MW plant polls Modbus TCP from inverters at 1 to 5 second intervals, IEC 61850 GOOSE from the substation at sub-cycle speeds, and Modbus RTU from meteorological stations at 1 minute intervals. The EPRI utility-scale PV monitoring guideline recommends storing 1-second granularity at the gateway for at least 30 days, then aggregating to 1-minute and 15-minute resolutions in the historian. That tiered retention is the difference between a useful forensic record and a dashboard you can plot.
Utility scale solar monitoring stacks that skip the DAS layer (or use the SCADA poll engine as a de facto DAS) suffer cascading data loss the first time a WAN circuit blinks. Insist on a discrete DAS appliance, locally buffered, with at least 72 hours of store-and-forward capacity. Our reference architecture for DAS gateway design on PV plants covers sizing rules in depth.
Where SCADA ends and the power plant controller begins
The Power Plant Controller (PPC) is the third sibling. It executes grid-following commands from the utility: reactive power setpoints, ramp rate limits, frequency response, and curtailment. SCADA can route commands to the PPC, but the PPC owns the closed-loop math that decides how to spread the setpoint across 40 inverter blocks while respecting plant constraints. The NERC PRC-024 standard defines the voltage and frequency ride-through bands the PPC has to enforce; falling outside those bands trips your interconnection agreement.
In practice, a 200 MW plant has a SCADA HMI in the substation control house, a PPC chassis next to it, and a separate monitoring server in the corporate DMZ. All three talk to the same fleet of inverters, but through distinct paths and with different rights. Asset owners frequently ask why they cannot just consolidate. The answer is regulatory and operational: the PPC runs a hard real-time loop, SCADA runs a soft real-time control loop, and monitoring has no real-time requirement. Combining them violates the ISA-95 enterprise-control system integration model and turns every protocol change into a plant-wide outage. The full PPC commissioning sequence appears in our PPC commissioning playbook.
Choosing utility scale solar monitoring architecture by plant size
Plant capacity changes the architecture. Below 20 MW, a single monitoring server polling the inverters directly via Modbus TCP often suffices, and many sites still use the inverter vendor’s portal as the primary dashboard. Between 20 and 100 MW, utility scale solar monitoring earns its name: a dedicated DAS gateway, a PI Historian or InfluxDB instance, and a separate SCADA HMI for the substation. Above 100 MW, the architecture splits further into redundant SCADA servers, a dedicated PPC chassis, and a historian sized for billions of tags per year.
The SEIA utility-scale solar best practices note that lender requirements often dictate the floor. Tax equity partners and debt holders expect 5-year retention of 1-minute data, 99.5% data completeness on revenue metering, and signed availability calculations every month. Utility scale solar monitoring stacks that cannot produce a defensible performance ratio audit lose roughly 0.25% of project IRR on average during refinancing.
Plant size also drives protocol choice. A 30 MW plant runs cleanly on Modbus TCP. A 300 MW plant with a 230 kV substation needs IEC 61850 for the protection and metering buses, with utility scale solar monitoring stitched in via a dedicated GOOSE subscriber. Match the protocol stack to the plant, not the other way around.
There is a full breakdown of this topic in Solar SCADA Failover Architecture for High Availability Plants.
For a closer look at this, see How solar SCADA reduces unplanned downtime at utility-scale plants.
We cover the details separately in Solar Curtailment and AGC in Utility-Scale Solar Plant Operations.
Data points and tag taxonomy every plant needs
Tag taxonomy is the unglamorous half of solar monitoring that determines whether your historian is searchable in year five. A consistent naming convention (e.g., PLANT.BLOCK.INVERTER.PARAM) lets you write generic queries across the fleet; an inconsistent one forces O&M to maintain a spreadsheet of which inverter uses which tag. The NIST guidelines for industrial control system security include a section on data labeling that maps cleanly onto solar plant taxonomies.
A defensible tag set for utility scale solar monitoring at a 100 MW plant runs to roughly 60,000 tags: 800 per inverter block, 200 per met station, 4,000 in the substation, plus tracker, security, and SCADA-internal tags. Discard any tag you cannot tie to a specific KPI, alarm, or regulatory report. Bloat kills query performance and forces premature historian upgrades. Our breakdown of historian tag taxonomy for solar plants includes a starter naming standard you can adapt.
Plant operators also benefit from versioning the tag database the same way they version PLC code. Every commissioning revision, every inverter replacement, and every met station upgrade leaves a fingerprint in the historian. Without version control, year-five engineering teams cannot answer simple questions about why a tag changed scale or units.

Frequently asked questions
What is the difference between SCADA and DAS in utility scale solar monitoring?
SCADA controls and commands plant equipment; DAS reads data from it and forwards to the historian. SCADA writes setpoints to inverters, opens breakers, and enforces interlocks. DAS polls Modbus registers, timestamps the values, and ships them upstream. Most utility-scale plants run both: a SCADA stack in the substation control house for operations, and a DAS gateway feeding a separate monitoring historian. The EPRI utility-scale PV monitoring guideline recommends keeping the two on separate network zones to prevent monitoring traffic from contaminating control-loop latency.
Is utility-scale solar monitoring required by NERC?
NERC does not mandate monitoring per se, but several reliability standards effectively require it. PRC-024-3 dictates frequency and voltage ride-through, which the plant must prove with monitored data. MOD-026 and MOD-027 require model validation that depends on captured fault records. The NERC reliability standards library lists the full set. For plants connected at 100 kV and above, the BES classification triggers CIP cybersecurity controls on the monitoring and control infrastructure, including configuration management, access logging, and patch tracking. Field audits typically reference IEC 61850 logging requirements alongside the NERC checks.
How long should solar monitoring data be retained?
Most lenders require 5 to 10 years of 1-minute revenue-grade data, with 1-second granularity available for at least 30 days at the plant gateway. The U.S. Department of Energy SunShot best practices guide recommends tiered retention: 1-second locally for 30 days, 1-minute in the historian for 5 years, and 15-minute aggregates indefinitely. Retention drives storage cost more than collection rate does, so plan the historian sizing for the entire PPA term, not just year one. Compression ratios on solar data typically run 10 to 1 on rotating storage.
Can the inverter vendor’s monitoring portal replace a dedicated SCADA system?
Not for utility-scale plants. Vendor portals provide visibility into the inverter fleet but do not integrate substation, meteorological, tracker, or PPC data. They also do not provide control authority and rarely satisfy lender requirements for independent monitoring. The FERC standard interconnection requirements for plants over 20 MW assume an independent SCADA system that meets utility-specific requirements. Use the vendor portal as a secondary diagnostic tool, never as the primary system of record. Some owners deploy the vendor portal in parallel for inverter-specific diagnostics, but the system of record stays with the independent monitoring stack.


