
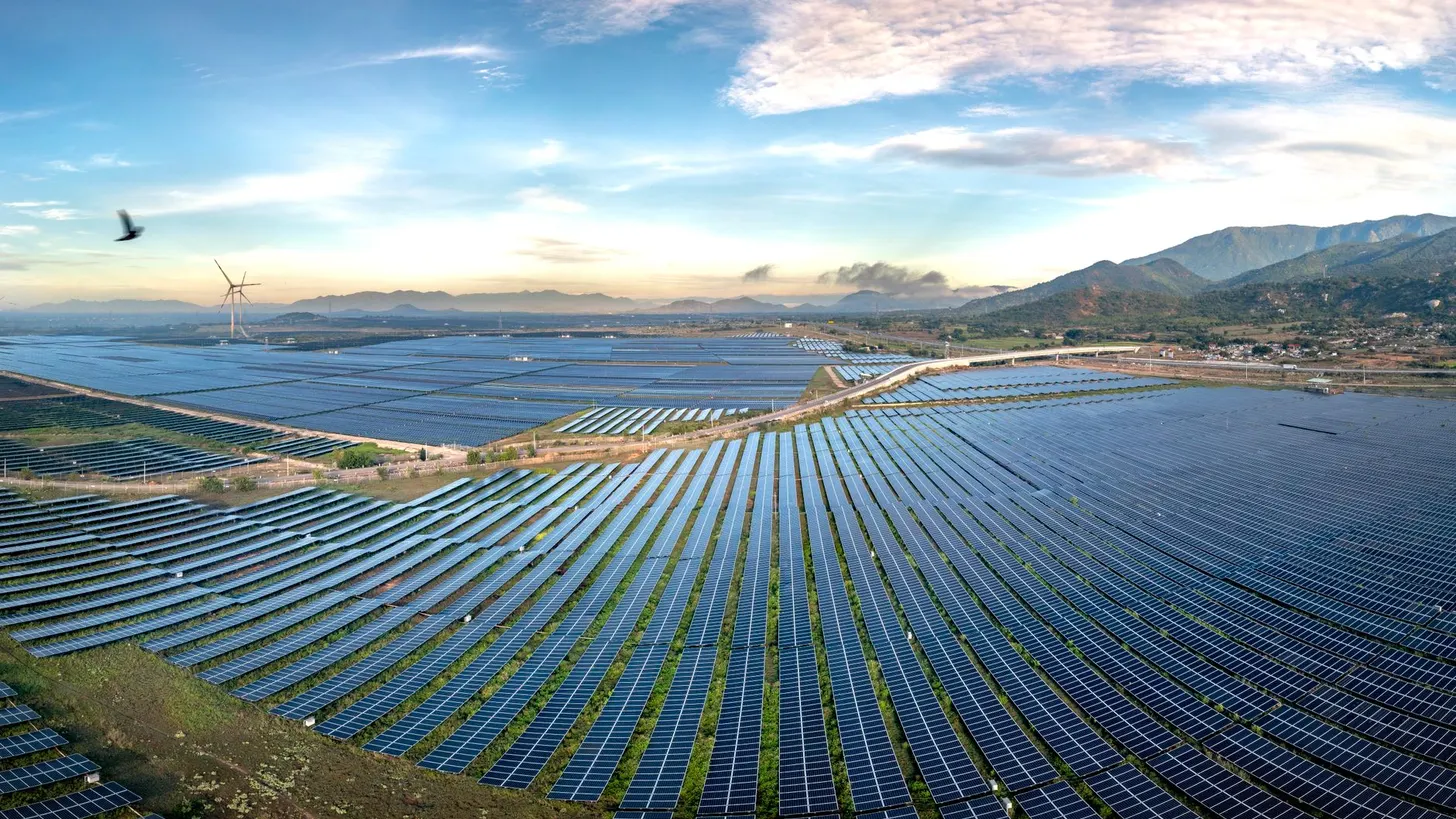
Solar drone thermal inspection: utility-scale hotspot field guide
IEC TS 62446-3:2017 sets a hard rule: any thermal delta above 10 K is a serious anomaly demanding immediate corrective action. Solar drone thermal inspection is the only survey method that catches those cell hotspots, bypass diode failures, and string mismatches at fleet scale before they burn glass, delaminate laminates, or trigger arc events. This field guide covers IEC flight parameters, delta-K interpretation, SCADA integration, and the FAA Part 107 waivers utility-scale sites need to fly complete coverage.
What solar drone thermal inspection detects that IV curve testing misses
Solar drone thermal inspection surfaces defects invisible to string-level electrical testing: single cell hotspots, bypass diode failures, junction box heating, potential induced degradation patterns, cracked backsheets, and open interconnect ribbons. Ground-based IV curve traces integrate current across a whole string, so one bad cell in 72 blurs into the string average and passes acceptance.
NREL field studies have logged hotspot cell temperatures over 80 °C above ambient in multi-crystalline modules with partial shading mismatch. Those cells degrade at 3 to 5 times the rate of healthy cells, so a shaded string that passes IV curve tracing today ships with EL cracks and delaminated laminates within two years. Only aerial thermography catches the temperature signature before it becomes an insurance claim. See the NREL PV reliability program for degradation studies on hotspot-driven failure modes.
Bypass diode failures are the second class. A shorted bypass diode drops one third of a module out of the circuit; the affected substring runs cold while the healthy substrings run at open circuit voltage. Ground techs never see it because the string still passes DC health checks; drone thermal picks the cold third-of-module signature instantly. The internal guide on utility-scale solar monitoring versus SCADA covers where DAS data hides these faults in aggregate.
For a closer look at this, see Solar Farm Revenue Metering: ANSI C12.20 Accuracy Field Guide.
IEC TS 62446-3 parameters for solar drone thermal inspection flights
IEC TS 62446-3:2017 is the anchor standard for solar drone thermal inspection surveys and it is prescriptive about environmental conditions. Irradiance at the plane of array must exceed 600 W/m2 for the entire flight window, wind speed should stay under 4 m/s to avoid cooling artifacts, and ambient temperature swings during the survey must remain within 5 K. See IEC published technical specifications for the full document.
The standard sets three severity bands. A delta below 2 K is noise. A delta between 2 K and 10 K is a minor anomaly logged for tracking. A delta above 10 K is a serious anomaly demanding immediate corrective action, which for utility-scale plants means a work order routed to the CMMS the same shift. Camera specifications call for 5 mrad instantaneous field of view per pixel or better, which translates to roughly 3 cm ground sample distance at 60 m altitude for a standard radiometric sensor.
Flight altitude between 30 and 60 m above the module plane keeps the survey inside the camera focus band and above rotor wash effects on shingled thin-film glass. Nadir look angle within 10 degrees of vertical minimizes glass reflection artifacts that read as false cold cells. See the field guide on DAS commissioning irradiance and weather QA for the pyranometer calibration procedure that verifies the 600 W/m2 floor.
| Method | Defect class caught | Typical coverage speed | Irradiance dependency | Primary standard |
|---|---|---|---|---|
| Solar drone thermal inspection (drone IR) | Hotspot cells, bypass diode faults, junction box heating, PID patterns, cracked backsheets, open interconnects | 1 to 5 MW per flight hour at 60 m altitude | 600 W/m2 POA minimum for full flight window | IEC TS 62446-3:2017 |
| EL imaging | Micro-cracks, inactive cell areas, shunts, finger interruptions | 0.1 to 0.5 MW per hour; dark or very-low-irradiance conditions required | Below 50 W/m2; direct sunlight voids results | IEC 60904-13 |
| IV curve tracing | String series resistance, shunt losses, Rs/Rsh degradation, mismatch losses | 4 to 8 strings per hour per technician | Minimum 200 W/m2; STC correction required | IEC 61829, IEC 62446-1 |
| Visual walk inspection | Physical damage, soiling, bird drop accumulation, frame corrosion, connector displacement | 0.5 to 2 MW per hour | None required | IEC 62446-1 |

Reading thermal deltas: from single cell to full string faults
Interpreting a solar drone thermal inspection thermogram is pattern recognition against a fault dictionary. A single bright cell with a delta greater than 10 K against neighbors is a shading-induced hotspot or a cracked cell driving current into itself. A bright substring covering roughly one third of the module face is usually a shorted bypass diode. A whole module bright end to end is a series resistance fault at the junction box or module connector.
Cold patterns are equally diagnostic. A cold cell reading well below its neighbors is a disconnected finger or busbar break. A cold substring is a shorted bypass diode from the other perspective, or a partial short across the substring. A cold whole module suggests an open circuit somewhere in the module string, and the crew should trace the fuse upstream before reflighting.
String-level cold patterns matter for asset management. If a whole string reads cold on the drone pass but the SCADA string monitor shows nominal current, one of the two systems is lying and the drone flight window is the tiebreaker. If the pass was flown outside irradiance spec, the SCADA reading wins. If the pass was in spec, the string monitor calibration or the current transformer is the culprit. See IEEE PV performance and reliability publications for peer-reviewed thermogram classification frameworks.
One hard lesson from a 48 MW fixed-tilt site REIG surveyed in South Carolina in 2023: a post-storm pass returned cold patterns on seven strings that the SCADA historian showed as producing normal current. The team initially routed those strings to field crew for inspection. The post-flight pyranometer log showed irradiance had dropped below 600 W/m2 for fourteen minutes at the start of the window, and all seven cold readings turned out to be calibration artifacts rather than real faults. That incident added a mandatory 15-minute stable irradiance hold above 600 W/m2 to the REIG pre-flight checklist before any first pass begins.
Structuring solar drone thermal inspection data for SCADA trend tracking
Solar drone thermal inspection is only as valuable as the pipeline that pushes findings into the CMMS and SCADA historian. Raw radiometric TIFFs and stitched orthomosaics are what the pilot delivers; the O&M value is in a normalized defect record keyed to tracker, string, and module serial number, with GPS coordinates, delta-K, and a defect class code.
Import defect records to the historian as sparse point tags: one tag per module ID, updated only when a survey occurs. That keeps historian storage manageable across a 300 MW fleet while preserving the module-level history a residual value auditor will demand at year seven. The field guide on solar SCADA alarm rules covers how to tie a delta-K threshold breach to an alarm without triggering nuisance floods.
Year-over-year trending is where thermographic surveys pay for themselves. A module that showed a 4 K delta last year and 8 K this year is on a failure curve; a module holding steady at 3 K is stable. See EPRI research on PV plant reliability and monitoring for the benchmark statistical models the industry uses for degradation forecasting. Cross-reference the performance ratio drift methodology documented in the IEC 61724-3 performance ratio guide.

For a closer look at this, see How solar SCADA reduces unplanned downtime at utility-scale plants.
For a closer look at this, see Solar SCADA cybersecurity NERC CIP: utility-scale compliance guide.
For a closer look at this, see BESS SCADA Integration for Utility-Scale Solar Plants: A Field Guide.
FAA Part 107 rules for utility-scale drone survey missions
FAA 14 CFR Part 107 governs every commercial small UAS flight in the United States. Part 107 requires visual line of sight, a 400 ft AGL ceiling, daylight or civil twilight operations with lighting, and a certified remote pilot. Sites over 400 acres exceed reliable VLOS from any single ground position, requiring a BVLOS waiver or a leapfrog crew rotation to achieve full-site coverage.
BVLOS waiver applications require documented detect-and-avoid capability, a safety case, and typically a ground-based radar or observer network. The DOE PV operation and maintenance guidance flags this waiver as the single largest schedule risk on annual inspection contracts. Budget six months for the initial waiver, less on renewals.
Airspace class matters as much as site size. Class G uncontrolled airspace is standard for rural solar farms; Class D or E surrounds many substation-adjacent sites and requires LAANC authorization before takeoff. Local NOTAM checks, TFRs around utility infrastructure, and county aerial hunting restrictions all layer on. A pre-flight checklist that misses any of those flips a lawful solar drone thermal inspection into an FAA violation the sponsor answers for. NIST has published UAS research through the Public Safety Communications Research program that informs many industry checklists.
For a closer look at this, see Solar Curtailment and AGC in Utility-Scale Solar Plant Operations.
Frequently asked questions
How often should a utility-scale plant run a solar drone thermal inspection?
Annual is the industry floor for fleets under warranty and semi-annual is the norm for plants past year eight where degradation accelerates. IEC TS 62446-3:2017 does not mandate a frequency, but insurance carriers and PPA offtakers increasingly write annual thermographic sweeps into contract language. For plants above 100 MW, rolling quarterly sweeps of one quarter of the site keep data current within 90 days on every block. See the IEC standards development portal for the underlying specification. Post-storm sweeps are additional and non-negotiable after hail events above 25 mm stone size.
What thermal delta triggers a work order versus a watch flag?
IEC TS 62446-3 puts the trigger at 10 K delta between the affected zone and healthy neighbors under the standard flight conditions. Anything between 2 and 10 K becomes a watch flag in the CMMS with a re-survey scheduled in the next cycle. Below 2 K is thermogram noise and gets discarded. Some asset managers tighten the work order threshold to 8 K for modules under warranty because a documented anomaly strengthens the warranty claim. Cross-reference the NREL PV research portfolio on progression rates when tuning local thresholds.
Can solar drone thermal inspection replace annual ground-based IV curve testing?
No. Aerial thermography and IV curve tracing are complementary and both belong in a mature O&M program. Drone thermal catches individual cell and connector faults at fleet scale that IV curve tracing cannot resolve. IV curve tracing quantifies string-level series resistance, shunt losses, and Rs/Rsh degradation that thermal cannot. On new construction and after major re-wiring, IV curve is the acceptance test. On operational fleets, drone thermal handles the wide-area screening and IV curve is a targeted follow-up on the strings the thermogram flagged. Reference the IEEE Journal of Photovoltaics for peer-reviewed comparisons of the two methods.
What irradiance and weather conditions invalidate a drone thermal survey?
Irradiance below 600 W/m2 at plane of array voids the survey per IEC TS 62446-3. Cloud shadow crossing during the pass creates false thermal signatures and requires re-flight of the affected block. Wind above 4 m/s causes convective cooling that suppresses hotspot delta values. Ambient temperature drift greater than 5 K during the survey window skews inter-image comparisons. A calibrated reference pyranometer logging at 1 Hz throughout the flight is the auditable record that regulators, insurers, and offtake counterparties demand when a claim rides on the survey data. See the DAS commissioning irradiance and weather QA guide for the pyranometer calibration procedure, and IEC TS 62446-3 in the IEC webstore for full survey parameters.
How is a Part 107 BVLOS waiver different from a standard Part 107 certificate?
A standard Part 107 remote pilot certificate authorizes VLOS operations under 400 ft AGL, daylight, in uncontrolled airspace. A BVLOS waiver adds Beyond Visual Line of Sight authorization for a specific operational area under a documented safety case. The FAA evaluates the applicant detect-and-avoid technology, redundancy, ground observers, and traffic management plan. Approval times run six to twelve months for a first waiver and 60 to 90 days for renewal. The DOE solar research portfolio catalogs waiver case studies most utility owners cite when scoping a program.
How do you tie drone thermal findings into an existing SCADA historian?
Create one point tag per module ID (or per string if module IDs are not persistent) in the historian and populate it only on survey days. Each tag stores delta-K, defect class code, GPS reference, and a link to the source thermogram. Alarm rules trigger only on threshold breach year over year, not on single-survey values, which keeps operator screens uncluttered. Trend charts driven by these tags become the exhibit an asset manager references at year seven when defending residual value or negotiating a warranty extension. See EPRI research programs for aggregation patterns most historians in North America follow.


