


Solar Curtailment and AGC in Utility-Scale Solar Plant Operations
In 2023, the California ISO curtailed 2.6 million MWh of utility-scale solar generation, enough to power 270,000 homes for a year. That number climbs every quarter as renewable capacity outpaces transmission build. Solar curtailment is no longer an edge case; it is a line item on every plant’s revenue forecast. Operators who lose the least pair tight SCADA setpoints with automatic generation control, and they instrument every inverter so dispatch teams act in seconds, not minutes.
What is solar curtailment and why does it matter for utility-scale plants?
Solar curtailment is the deliberate reduction of a plant’s output below what its panels could produce at that moment. The grid operator issues the command when transmission is congested, when supply exceeds demand, or when a frequency or voltage event requires an immediate ramp-down.
For a 100 MW PV plant under a $40/MWh PPA, every hour of full curtailment costs $4,000 in foregone energy revenue. Multiply that by hundreds of events per year and curtailment quickly becomes the largest controllable line item on the operator’s P&L. Lawrence Berkeley National Lab’s 2024 curtailment review documents over $1.5 billion in lost solar revenue across CAISO, ERCOT, and MISO during 2023.
Two trends keep the number climbing. First, interconnection queues have outpaced transmission build by a factor of three since 2018 according to NERC’s long-term reliability assessment. Second, midday solar saturation in sunny markets pushes prices below zero, triggering economic curtailment as merchant operators voluntarily back down to avoid negative settlement.
For a closer look at this, see BESS SCADA Integration for Utility-Scale Solar Plants: A Field Guide.
For a closer look at this, see Solar SCADA Alarm Rules: Cut Nuisance Noise on Utility-Scale Plants.
For a closer look at this, see How solar SCADA reduces unplanned downtime at utility-scale plants.
For a closer look at this, see SunSpec Modbus inverter: register maps for utility-scale solar plants.
For a closer look at this, see Utility Scale Solar Monitoring vs SCADA: Roles and Layers Defined.
For a closer look at this, see Modbus TCP vs DNP3: solar SCADA protocol guide for utility plants.
For a closer look at this, see Solar SCADA cybersecurity NERC CIP: utility-scale compliance guide.
For a closer look at this, see Solar plant SCADA system modernization: a utility upgrade roadmap.
For a closer look at this, see Solar drone thermal inspection: utility-scale hotspot field guide.
For a closer look at this, see Utility Scale Solar Monitoring vs SCADA: Roles and Layers Defined.
For a closer look at this, see Solar SCADA Alarm Rules: Cut Nuisance Noise on Utility-Scale Plants.
Common causes of solar curtailment at utility-scale plants
Solar curtailment events fall into four categories, and the cause determines how the plant must respond. Each category has different notification windows, ramp requirements, and revenue recovery rules under the interconnection agreement, which means the SCADA configuration must match the contracted dispatch profile.
Transmission congestion drives the largest share. When a line approaches its thermal rating, the system operator dispatches generators down by economic merit order. Solar with low marginal cost is often dispatched last, but in oversupplied zones it leads the cut. EIA hourly electricity generation data shows congestion-driven curtailment concentrating in spring shoulder months when load is low and solar output peaks.
Frequency response is the fastest category. When system frequency drops below 60 Hz, AGC-enrolled plants ramp up; when frequency rises, they ramp down within four seconds. Plants without AGC certification miss this market entirely. Voltage regulation events follow. The plant’s reactive power capability and inverter Q-priority settings determine whether the SCADA system can hold voltage without cutting active power.
Economic or self-curtailment is the fourth category. Merchant operators reduce output when locational marginal prices go negative, which now occurs during 8-12% of daylight hours in parts of West Texas based on the ISO settlement data published in EIA wholesale reports.
| Curtailment type | Typical response window | Revenue recovery |
|---|---|---|
| Transmission congestion | 5-15 minutes | Partial via curtailment payments |
| Frequency response | Under 4 seconds | Ancillary service revenue |
| Voltage regulation | 1-5 minutes | None typically |
| Economic / negative LMP | Plant discretion | Avoided negative settlement |
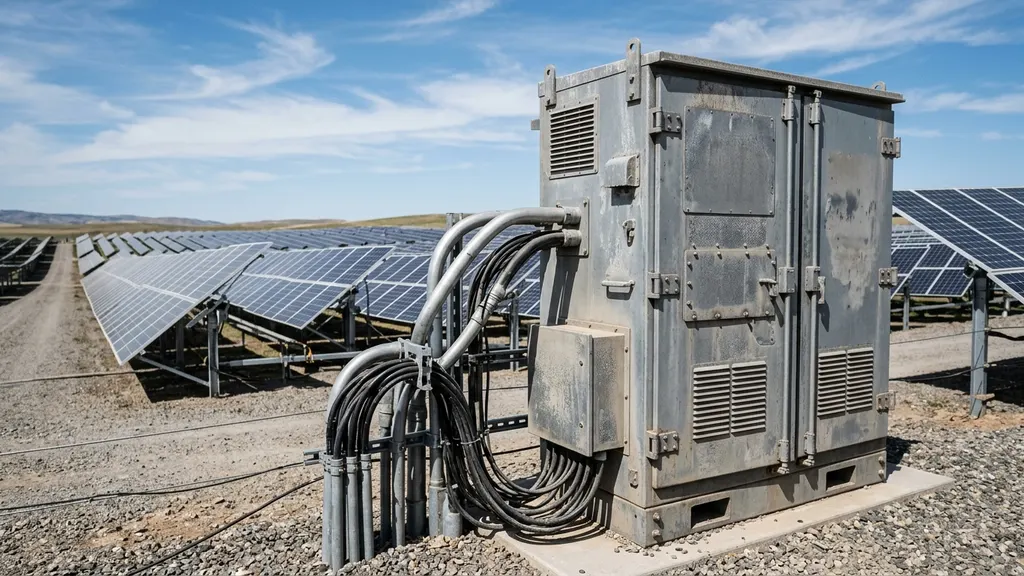
SCADA architecture for active power control
The SCADA system is where curtailment commands are received, distributed, and verified. A solar plant SCADA stack has three layers: the plant controller, the inverter network, and the substation interface. Each layer has a specific role in the response chain that manages solar curtailment compliance.
The plant controller receives the setpoint from the grid operator’s energy management system over a DNP3 or IEC 61850 link. IEC 61850-7-420 defines the data model for distributed energy resources, and most North American projects built after 2022 standardize on it. The PPC then distributes per-inverter setpoints based on irradiance, temperature, and individual inverter availability.
Inverter response times vary by manufacturer and firmware. Central inverters from Sungrow, SMA, and Power Electronics complete a 100% to 50% ramp in under 2 seconds. String inverter fleets are slower because the command must propagate across hundreds of devices over Modbus TCP. Plant designers should benchmark this latency during factory acceptance testing, as ISO interconnection requirements and NERC reliability standards govern inverter response performance.
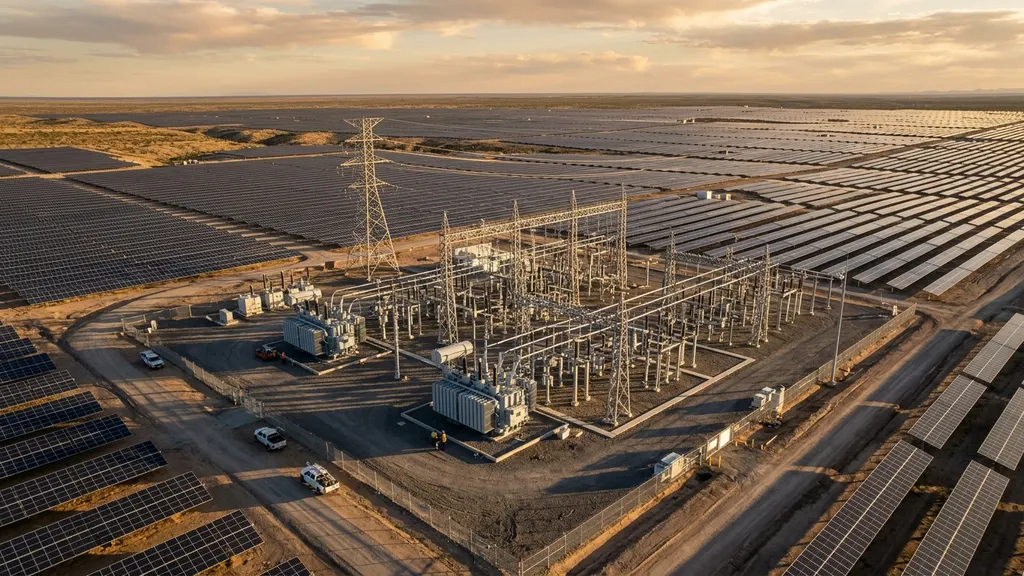
The substation revenue meter provides closed-loop verification. The PPC compares meter output against the active setpoint every second and adjusts the per-inverter dispatch to hold the plant at the target. Without this feedback loop, the plant drifts above or below setpoint and risks penalty under the interconnection agreement.
For a closer look at this, see Solar Power Plant Controller: SCADA Integration, Setpoints, Limits.
For a closer look at this, see Solar Power Plant Controller: SCADA Integration, Setpoints, Limits.
How AGC integrates with SCADA for solar curtailment management
Automatic generation control extends the SCADA stack to participate in real-time energy markets. AGC adds a continuous setpoint stream from the ISO that updates every 4 to 6 seconds. The plant must follow that signal without operator intervention, which raises the bar on SCADA reliability and inverter response.
CAISO, ERCOT, and SPP all require AGC participation for resources earning regulation revenue. The certification test involves a 15-minute step-response sequence in which the ISO sends pseudo-random setpoints between 20% and 100% of rated output. The plant must hold each setpoint within 2% tolerance and ramp at the contracted rate.
For solar plants, AGC introduces an asymmetric problem. The plant can always ramp down to apply solar curtailment, but it can only ramp up to the prevailing irradiance ceiling. This means AGC-enrolled solar must reserve headroom by operating below maximum power, typically 5-10% below the irradiance-implied ceiling. The reserved headroom is the regulation product the plant sells.
Plant controllers handle the headroom calculation by integrating real-time pyranometer data with inverter DC capability curves. NREL’s grid integration research documents revenue stacking strategies where the headroom cost is offset by regulation payments of $4-12 per MW-hour depending on the market. For deeper context, see our breakdown of AGC frequency response in solar plants.
DAS and metering requirements for curtailment events
The data acquisition system records what actually happened during every solar curtailment event. Without high-resolution DAS data, the operator cannot dispute curtailment payments, prove compliance with the AGC certification, or recover lost generation through make-whole provisions in the PPA between the plant and the offtaker.
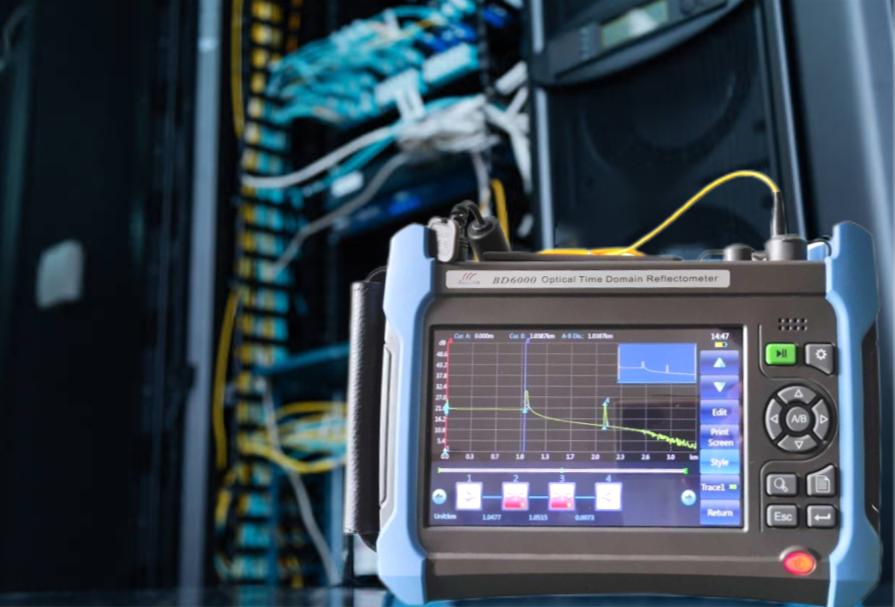
Minimum DAS specifications for utility-scale solar curtailment include 1-minute logging of plant active power, plant setpoint, available power (the would-have-been generation), irradiance, and per-inverter status. IEEE 1547-2018 sets the interconnection performance reporting framework that most US ISOs reference.
Available power is the most contested data point. It is calculated by running an irradiance-to-power model against pyranometer measurements, then de-rating for actual inverter availability. EPRI’s curtailment measurement guidelines recommend three pyranometers per 100 MW with cross-validation to reject soiling errors above 3%.
Plants without disciplined DAS practice routinely lose 1-3% of annual revenue to undocumented curtailment. The investment in extra pyranometers and a tight DAS database pays back inside the first audit cycle.

Operational best practices to reduce solar curtailment losses
Plants that minimize solar curtailment exposure follow five disciplines. None of them require capital upgrades; they are configuration and process changes that the O&M team can implement within a quarter. Each discipline targets a specific category of revenue loss documented in EPRI field studies.
First, tune the PPC PID loop. Most plants ship with default PID coefficients that produce 5-8% overshoot on setpoint changes. Field tuning brings overshoot below 2% and reduces curtailment energy loss by 0.5-1% annually. The tuning exercise takes a single field engineer two days using a step-response test bed.
Second, monitor inverter availability in real time. A single offline inverter in a 100 MW plant during a curtailment event means the remaining inverters must run closer to maximum, which compresses headroom and risks setpoint excursion. OSHA-aligned safety procedures for inverter swaps should be combined with SCADA work permits to maintain curtailment compliance during maintenance.
Third, register for ancillary service markets. Even if the plant cannot meet full regulation requirements, frequency response and reactive power services have lower entry bars and generate $50,000 to $200,000 per 100 MW annually.
Fourth, integrate weather forecasts into the bidding strategy. Day-ahead curtailment exposure correlates with regional irradiance and load forecast errors. Plants that bid into the day-ahead market based on accurate next-day production avoid economic curtailment by aligning offers with expected dispatch.
Fifth, audit the SCADA-to-meter loop monthly. Setpoint drift between the PPC command and the revenue meter feedback is the most common cause of curtailment penalty. A monthly audit catches drift before it accumulates into a chargeable event. For more on commissioning practices, see our guide on solar SCADA commissioning checklists and our deep dive on DAS pyranometer best practices.
Frequently asked questions
What does solar curtailment cost per MWh?
Curtailment cost varies by market structure and PPA terms. Under a typical fixed-price PPA, curtailed energy is lost revenue at the contract rate, usually $35-$65 per MWh for utility-scale solar signed between 2020 and 2024. Merchant plants face wholesale market pricing, which can swing from $20 negative to $200 positive per MWh during the same day. EIA wholesale market data tracks these spreads. Total curtailment cost includes lost energy revenue plus AGC ancillary penalties and any PPA make-whole obligations that the offtaker has not exercised.
How does AGC differ from manual curtailment dispatch?
Manual curtailment uses a single setpoint sent over hours or minutes. AGC uses a continuous setpoint stream updating every 4 to 6 seconds, requiring the plant to follow the signal automatically. AGC enrollment qualifies the plant for regulation revenue in markets like CAISO and ERCOT, which compensates the operator for the headroom reserved to provide that service. Manual dispatch is simpler but earns no ancillary income. Most plants over 50 MW built after 2023 enroll in AGC to capture regulation revenue per FERC market rules.
What SCADA hardware is required for AGC participation?
The plant needs a certified power plant controller with DNP3 or IEC 61850 communication to the ISO, sub-second internal cycle time, and verified inverter dispatch latency under 2 seconds. The substation revenue meter must support 1-second readings into the PPC feedback loop. Most projects pair these with a redundant historian and a backup PPC in hot-standby. NIST smart grid framework guidance applies, and vendor certifications from the local ISO are required before commissioning the AGC interface for active power control.
Can solar plants without batteries provide regulation?
Yes, but only by operating below maximum power to reserve up-regulation headroom. A 100 MW plant might curtail itself 5-10% during daylight to bid 5-10 MW of regulation capacity. The lost energy revenue is offset by regulation payments of $4-12 per MW-hour. Plants with battery storage avoid the headroom tradeoff and can offer symmetric regulation in both directions, which earns higher payments. NREL grid integration analysis shows battery-paired plants earn 2-3x the ancillary revenue of solar-only regulation strategies.


