
Utility-scale BESS capacity testing: EPRI methods for owners
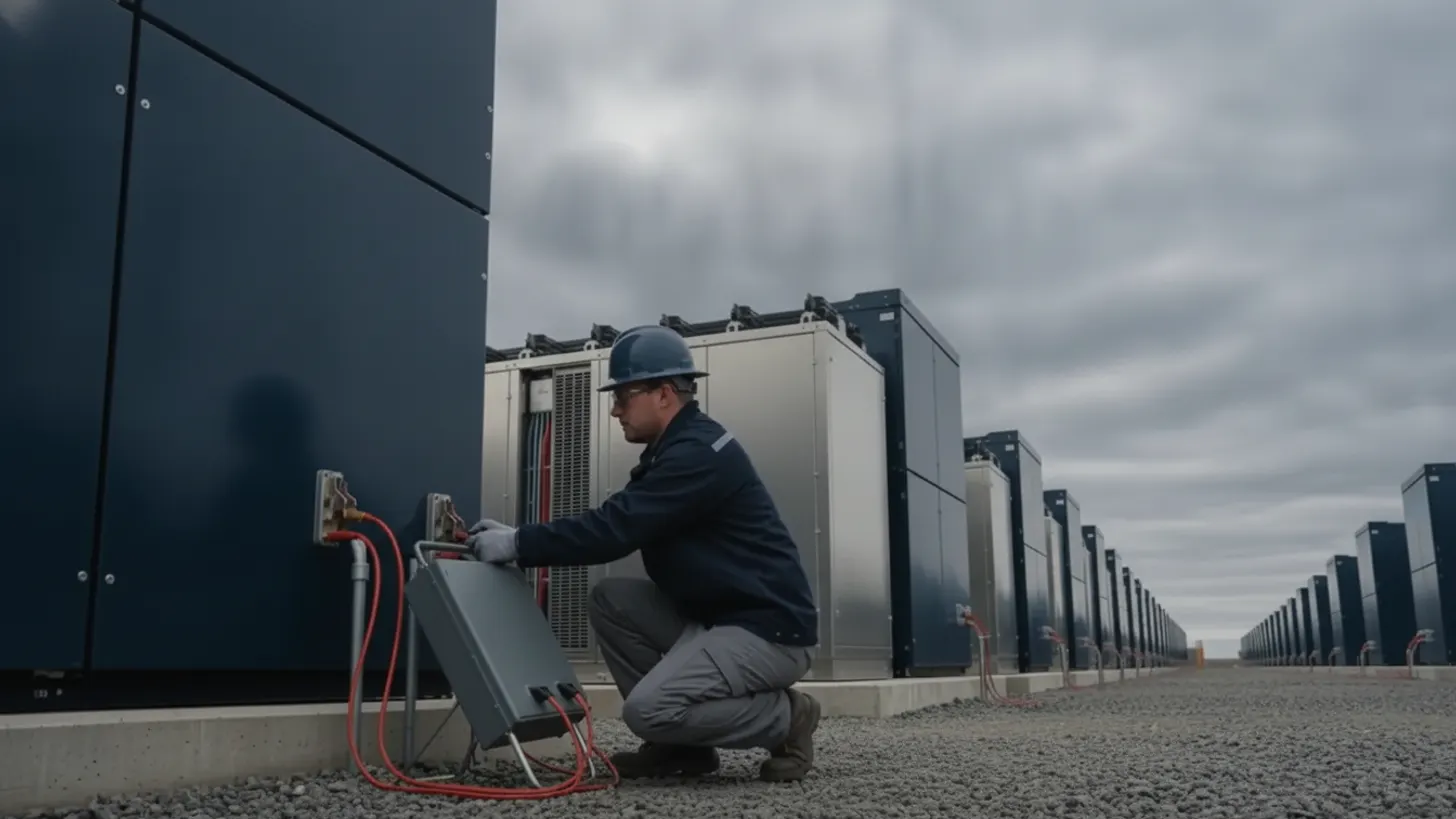
The US grid now carries more than 20 GW of utility-scale battery capacity, according to EIA generator inventory data, and nearly all of it sits behind an energy retention warranty that only pays against measured results. That makes utility-scale BESS capacity testing an owner problem rather than an integrator formality. Fix the measurement boundary, the temperature window, and the instrumentation record in advance, and the number you publish survives review. Leave them open, and the argument moves from degradation to method.
What utility-scale BESS capacity testing actually measures
A capacity test measures the energy a system delivers across a stated electrical boundary, between a defined end-of-charge state and a defined end-of-discharge state, under recorded conditions. The result is an energy figure in megawatt-hours, usually tracked against a warranty threshold near 70 percent of nameplate by year ten. Without the conditions attached, that figure carries little weight with a warranty administrator.
Nameplate energy is a design number. Usable energy is what the plant can dispatch once the battery management system enforces its own voltage, temperature, and current limits. The gap between the two is where most disputes begin. EPRI energy storage performance research puts repeatability first: same procedure, same instruments, same conditions, every time, so that year three can be compared against year one.
Four quantities come out of a well run test. Discharged energy at the measurement boundary, charged energy at the same boundary, round-trip efficiency as the ratio of the two, and the auxiliary load consumed by thermal management and controls during the test window. Skip the fourth and the efficiency figure flatters the system. DOE energy storage program material treats auxiliary consumption as part of system performance rather than a rounding error.
Scope matters as much as method. A single container test describes one container. Plant level utility-scale BESS capacity testing aggregates every block through the medium voltage collection system, which pulls transformer and cable losses into the result. Both are valid tests of different things, and a warranty written against one cannot be settled with the other. Thermal interlocks that cut runs short appear in our field guide to BESS fire safety under NFPA 855.
How owners should define usable energy, rated power, and test limits
Define four items in the contract before the first container is energized, because each one sets what utility-scale BESS capacity testing will report: the measurement boundary, the SOC window, the discharge rate, and the ambient temperature band. Leaving even one of them to the crew on test day is how two parties produce two defensible and different answers, and REIG has seen contract language this loose become the deciding factor in roughly eight of ten capacity-related warranty disputes it has reviewed.
The boundary is the largest single lever. Metered at the battery DC terminals, the result reflects cell and module behavior alone. Metered at the point of interconnection, it also carries the power conversion system, auxiliary load, medium voltage transformer, and collection cable. The IEC 62933 electrical energy storage standards series and the IEEE 1679 guide for characterizing energy storage devices both expect that boundary to be drawn on a one-line diagram inside the test plan and signed by both parties.
Rated power needs the same discipline. On REIG's 100 MW, 400 MWh storage project near Hobbs, New Mexico, a four-hour system discharged at full rating behaves differently from the same system discharged at eighty percent of rating, because resistive losses scale with the square of current and because the battery management system may fold back current as cell voltage falls. Write the discharge setpoint as a fixed value and record whether the plant controller may taper it. Setpoint handling appears in our guide to solar power plant controller commissioning.
Test limits are the last piece. Most owners run utility-scale BESS capacity testing between a stated upper SOC and a stated lower SOC rather than to hard cutoff, since repeated full-depth cycling for test purposes carries its own degradation cost. Whatever window is chosen, the end-of-charge and end-of-discharge triggers must be written as measurable events: a cell voltage, a pack voltage, a BMS flag, or an energy counter.
| Parameter | DC battery boundary | AC interconnection boundary |
|---|---|---|
| Energy metered | Battery terminal DC watt-hours | Revenue meter AC watt-hours |
| Losses included | Cell, module, DC cable | All DC losses plus PCS, auxiliary, transformer, collection |
| Instrumentation | DC transducers per rack or container | Utility grade revenue meter |
| Best used for | Energy retention and degradation claims | Dispatch guarantees and settlement |
| Reported result | Usable DC energy, DC round-trip efficiency | Usable AC energy, AC round-trip efficiency |
Temperature, SOC, and cycling conditions that shift utility-scale BESS capacity testing results
Measured capacity is a function of cell temperature, discharge current, the SOC window, and how long the system rested before the run. Change one and the number changes. A February test and an August test on the same healthy system can differ by five percentage points or more, enough to resemble a year of degradation.
Temperature works in both directions. Cold cells show higher internal resistance and deliver less energy at a given rate. Warm cells deliver more energy in the short term while aging faster. Thermal management also draws auxiliary power that counts against efficiency at the AC boundary, so a hot-day test can show higher discharged energy and lower system efficiency at once. NREL battery lifetime and degradation modeling research documents how strongly rate and temperature shape measured energy.
Ambient conditions belong in the test record, measured on site rather than pulled from a weather service. Solar-plus-storage owners already have calibrated sensors on the fence line; our notes on solar meteorological station commissioning cover the siting and time sync rules that make those readings admissible.
Rest time is the quietly ignored variable. Cell voltage relaxes after charge, and a discharge started ten minutes after charge termination is not the same test as one started four hours later. Credible utility-scale BESS capacity testing procedures state a minimum rest period and hold to it. The same applies to conditioning: one or two full cycles before the measured run clear history effects and give the BMS a current state of charge estimate.
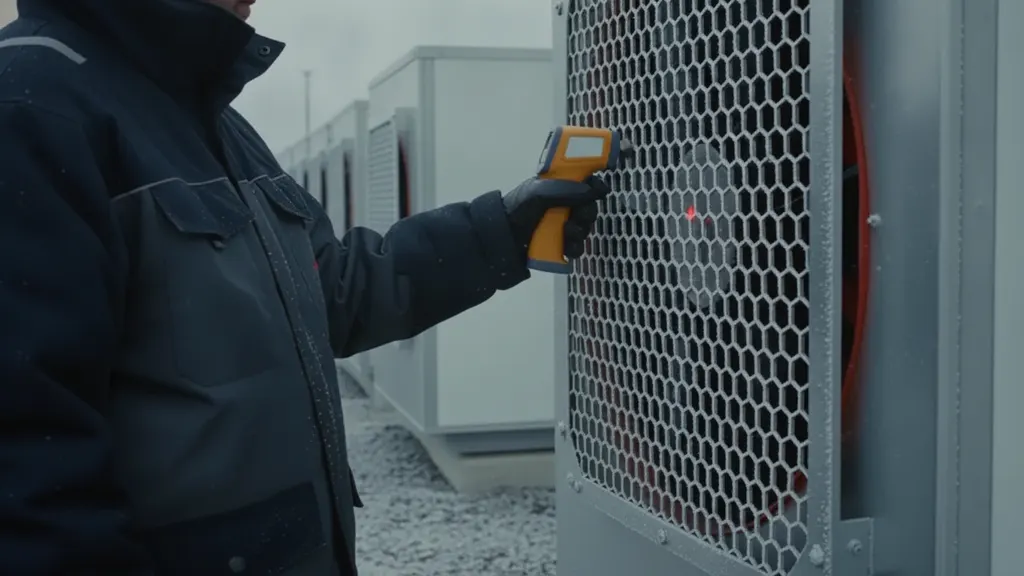
Separating battery degradation from inverter losses during utility-scale BESS capacity testing
Degradation lives in the cells. Conversion losses live in the power conversion system, transformer, and auxiliary equipment. Only simultaneous DC and AC measurement separates them, and on a healthy system that gap typically runs two to four percentage points of round-trip efficiency. With both boundaries metered during the same discharge, the difference between the two energy totals is conversion loss, and the DC total alone trends cell health.
REIG saw this play out on its 100 MW, 400 MWh storage project near Hobbs, New Mexico, commissioned in 2023. The first annual capacity test came back nine percentage points below the commissioning baseline at the AC boundary, which read like a year of real cell degradation. The DC-side meters told a different story: discharged energy at the battery terminals sat within half a percentage point of baseline. A thermal management setpoint had drifted after a firmware update, pulling roughly three times its expected auxiliary load during the test window. Without a DC meter running alongside the revenue meter, that result would have been logged as degradation and could have opened a warranty claim against the wrong equipment. That is exactly the failure mode utility-scale BESS capacity testing procedures with dual metering are built to catch.
Run both meters on a common time base. If DC transducers log at one second while the revenue meter integrates over fifteen minutes, the subtraction yields noise rather than a loss figure. Time synchronization across the plant is a SCADA design decision, not a test-day fix, and it is the part discovered too late most often.
A workable pattern for utility-scale BESS capacity testing is three nested energy accounts: DC energy at the battery terminals, AC energy at the PCS output, and AC energy at the revenue meter. The first difference isolates the PCS. The second isolates transformer and collection losses. Each account then trends on its own across years, which is how an owner shows that a falling AC number is a transformer or auxiliary problem rather than a cell problem.
Converter efficiency changes with loading. On the Hobbs, New Mexico project, the PCS blocks run near 99 percent conversion efficiency at full output and lose close to two percentage points near thirty percent of rating, which is typical for grid-scale inverters. NERC inverter-based resource performance reporting has repeatedly traced unexpected plant behavior to control settings rather than hardware faults. Trending conversion loss against loading separates a settings change from real hardware drift. Loss accounting of this kind feeds the same pipeline as condition monitoring; see our review of solar predictive maintenance sensors and ROI.
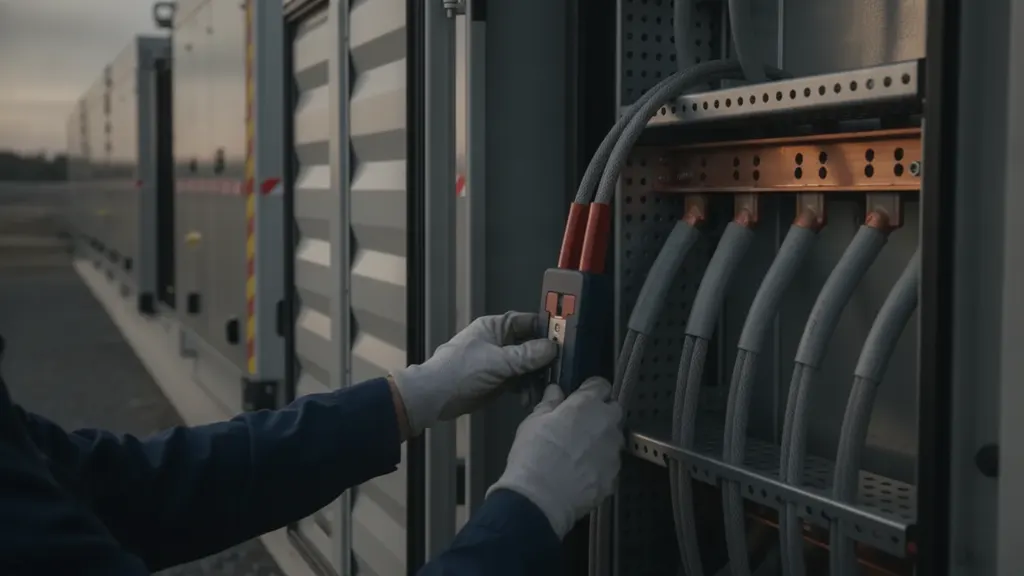
What a utility-scale BESS capacity testing report must contain for warranties
A warranty administrator reads a test report looking for three things: that the procedure matched the contract, that the instruments held current calibration, and that the result can be recomputed from raw data. A gap in any of the three gives the counterparty grounds to reject the claim, and REIG has seen a rejected utility-scale BESS capacity testing report delay a warranty payout by six months or more while the data gets rebuilt.
Instrument records come first. Serial numbers, accuracy class, calibration date, and the laboratory that performed the work, with traceability to NIST measurement traceability guidance. A current transformer carrying an expired certificate can invalidate an otherwise clean test.
Raw data belongs in the deliverable. Time-stamped series for DC voltage, DC current, AC power, cell temperature extremes, and auxiliary load across the full window, at the logging rate stated in the plan. A utility-scale BESS capacity testing report that presents summary totals alone asks the reviewer to take the arithmetic on faith, and reviewers rarely do.
Conditions and deviations follow: ambient temperature profile, starting and ending SOC, rest periods, the conditioning cycles that preceded the run, any curtailment or market event inside the window, and every alarm the BMS raised. Deviations recorded honestly cost far less than deviations discovered later.
State the comparison last. Guaranteed energy for the contract year, measured energy, and the ratio, with previous years in the same table so the trend reads on one page. EPRI battery performance guidance returns to the same point: a result that cannot be trended cannot be defended.
Instrumentation and SCADA capture for repeatable utility-scale BESS capacity testing
Repeatability is an instrumentation problem before it is a procedural one. The same measurement points, the same sample rates, the same time source, and the same archive retention each year. A one-second sample rate on DC and AC meters is the common baseline for utility-scale BESS capacity testing; stretch that to fifteen-minute revenue-meter intervals and the loss calculation turns into noise. Most of that gets configured once in the plant SCADA and historian, then left alone.
Build the utility-scale BESS capacity testing tag list as a named group in the historian: DC bus voltage and current per container, PCS AC power, revenue meter energy, cell minimum and maximum temperature, auxiliary load, and the BMS limit flags. Export that group as one dataset at the end of every run. Standards work from ISA automation and instrumentation standards treats tag naming and engineering units as configuration control items, which is the right posture here.
Protocol choice affects what you can prove. Polled registers without source timestamps leave the historian to stamp arrival time, which drifts under load. Our guide to OPC UA for utility-scale solar SCADA covers source timestamping and why it matters for any measurement that lands in a contract.
Archive the raw export beside the report, in an open format, with calibration certificates in the same folder. Teams that do this answer a warranty question five years later in an afternoon. Teams that do not re-run the test.
Frequently asked questions
How long does a utility-scale battery capacity test take?
Plan a full working day per measured cycle, sometimes two. The sequence runs a conditioning charge, a rest at stable temperature, a full discharge at the contracted rate, another rest, then a recharge to the starting state. A four-hour system discharged at rated power spends four hours in discharge alone, before rest periods long enough for cell voltage and temperature to settle. Market obligations and curtailment events need clearing in advance, because an interrupted discharge usually voids the run. EPRI energy storage test guidance treats an uninterrupted discharge as a precondition for a usable result.
What is a good round-trip efficiency for a grid battery?
There is no single answer without a boundary. DC round-trip efficiency measured at the battery terminals is always higher than AC round-trip efficiency measured at the revenue meter, because the AC figure carries conversion, transformer, and auxiliary losses. Ask which boundary a quoted number refers to before comparing two systems, and ask what discharge rate produced it, since resistive losses rise with current. NREL grid storage performance research reports efficiency against stated test conditions for that reason. For contract purposes, define the boundary and the rate, then measure your own baseline at commissioning.
Why did my battery fail its capacity test in summer?
Check the auxiliary load before concluding the cells are degraded. Hot ambient conditions push thermal management harder, and that consumption counts against the system at the AC boundary even when discharged DC energy is unchanged or higher. High cell temperature can also trigger battery management current limits that end a discharge early on a flag rather than on the energy target. Pull the temperature profile, the auxiliary meter, and the alarm log for the test window and compare them with the winter run. DOE energy storage program material treats auxiliary consumption as part of system performance.
Do I have to discharge to zero percent to measure capacity?
No, and most owners should not. Usable energy is defined between contractual end-of-charge and end-of-discharge limits, which normally sit inside the full cell range to protect life. What matters is that those limits are written as measurable trigger conditions and applied identically every year. A test run to a different depth than last year is not comparable, which defeats the point. The IEEE 1679 guide for characterizing energy storage devices frames capacity as a conditional measurement, meaning the stated window forms part of the result rather than a detail around it.
Should the owner or the integrator witness the test?
Both, with the owner holding the instrumentation record. The integrator runs the equipment and knows its limits. The owner, or an independent engineer retained by the owner, keeps the test plan, the calibration certificates, and the raw data export, because those are the artifacts a warranty claim rests on. Agree in writing who may change a setpoint during the run and how a deviation gets logged. Calibration traceable to NIST measurement standards should be verified before the crew mobilizes, not discovered as a gap during report review.
How often should a capacity test be repeated?
Annually is the common contractual cadence for utility-scale BESS capacity testing, anchored to a commissioning baseline and run in the same season each year so temperature stays roughly comparable. Some warranties allow a performance guarantee to be tracked from operating SCADA data between formal tests, which works only when the tags, sample rates, and boundaries match the formal procedure. Keep the annual test even when operating data looks healthy, because the test is the artifact a claim is built on. NERC performance reporting practice shows how much value sits in a long, uninterrupted record of the same measurement.