
Utility-scale solar harmonics: IEEE 519 compliance field guide
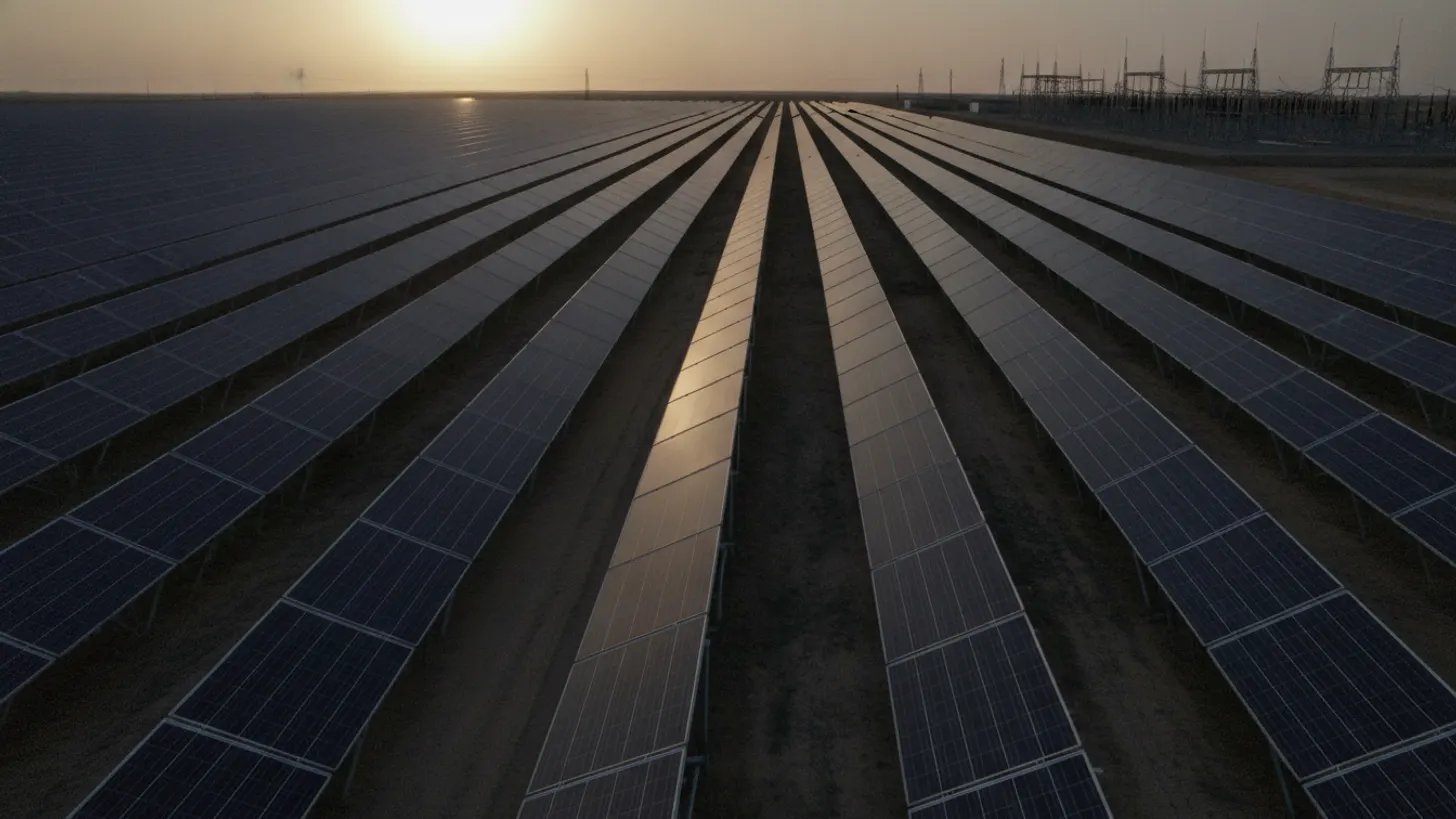
IEEE 519-2022 sets a total harmonic voltage distortion goal of 5 percent for systems rated 1 kV and below, and that one number settles more interconnection arguments than any other line in the standard. Utility-scale solar harmonics fail compliance tests at the point of common coupling, not at the inverter cabinet, which is why plants that pass factory tests still get flagged after energization. The fix is measurement discipline plus control tuning.
What causes utility-scale solar harmonics in a PV plant?
Utility-scale solar harmonics come from switching, not from sunlight. Every grid-tied inverter builds its AC output by chopping a DC bus at a carrier frequency, so the current it injects carries residual components at multiples of 60 Hz plus sidebands around the carrier. Plant impedance then turns those currents into voltage distortion.
Two mechanisms matter in the field. The first is the inverter: pulse-width modulation leaves residual current at low odd orders, mostly the 5th, 7th, 11th and 13th, plus a cluster of content near the switching carrier. The second is resonance. A collector system is a long run of shielded medium-voltage cable with real capacitance sitting behind a step-up transformer with real inductance, and that pair has a natural frequency. When it lands near an order the inverters already produce, a modest injected current becomes a large voltage. The EPRI power quality research program identifies inverter-based resources and power-electronic controls as important considerations in power quality analysis for that reason.
Distortion also changes with operating point. At low irradiance the inverters run at a fraction of rated current, so harmonic percentages referenced to the instantaneous fundamental read high even as absolute amperes fall. Night-time reactive support, auxiliary transformer load and tracker drives keep injecting when the array is dark. A test plan that samples only midday output will miss the worst hours of utility-scale solar harmonics. The same sampling trap appears in our solar plant voltage unbalance and flicker guide.
Which harmonic orders appear first
Field data from solar collector systems tends to cluster around a short list of orders, and each one points at a different part of the plant. The table below maps the usual suspects to a sensible first corrective step.
| Harmonic source | Dominant orders | First corrective step |
|---|---|---|
| Inverter PWM switching | 5th, 7th, 11th, 13th | Control firmware and carrier review with the OEM |
| Transformer saturation at light load | 3rd and triplen | Tap position and excitation check |
| Cable and transformer resonance | Broadband peak, often 11th to 17th | Frequency scan of the collector model |
| Auxiliary drives and tracker motors | 5th and 7th | Line reactors at the drive |
How IEEE 519 evaluates utility-scale solar harmonics at the point of common coupling
IEEE 519-2022 is an evaluation standard, not an equipment spec, and it screens more than 40 individual harmonic orders plus two aggregate indices, THD and TDD, at the point of common coupling, the boundary between the plant and the utility system. Inverter terminal data is useful for diagnosis, but it is not the compliance point.
On the voltage side the allowances tighten as voltage class rises. The standard lists a total harmonic voltage distortion goal of 5% for systems rated 1 kV and below, holds 5% through 69 kV, then drops to 2.5% between 69 kV and 161 kV and 1.5% above that. I learned this the hard way on the 180 MW Caprock Solar project we commissioned for a municipal utility outside San Angelo, Texas in March 2021: our team expected the low-voltage limit to be the hard one to hit, and got caught off guard when the transmission-side allowance, the strictest number in the document, turned out to be what the interconnection study flagged first. The limits are set out in the IEEE 519-2022 harmonic control standard.
The current side works differently. The standard expresses harmonic current allowances as total demand distortion scaled by the short-circuit ratio, Isc/IL, at the point of common coupling. A stiff bus with a high ratio tolerates more injected current than a weak one. That single ratio drives the whole screening exercise, which is why harmonics belong in the same package as the solar grid interconnection study rather than in a separate review after energization.
Both sides are judged statistically, not by peak readings. The standard works from time-varying characteristics: daily 99th percentile very short time values of 3 seconds, and weekly 95th percentile short time values of 10 minutes. A single high sample during a cloud transient is not a violation, and a plant that looks clean for one hour of utility-scale solar harmonics data has proved nothing.
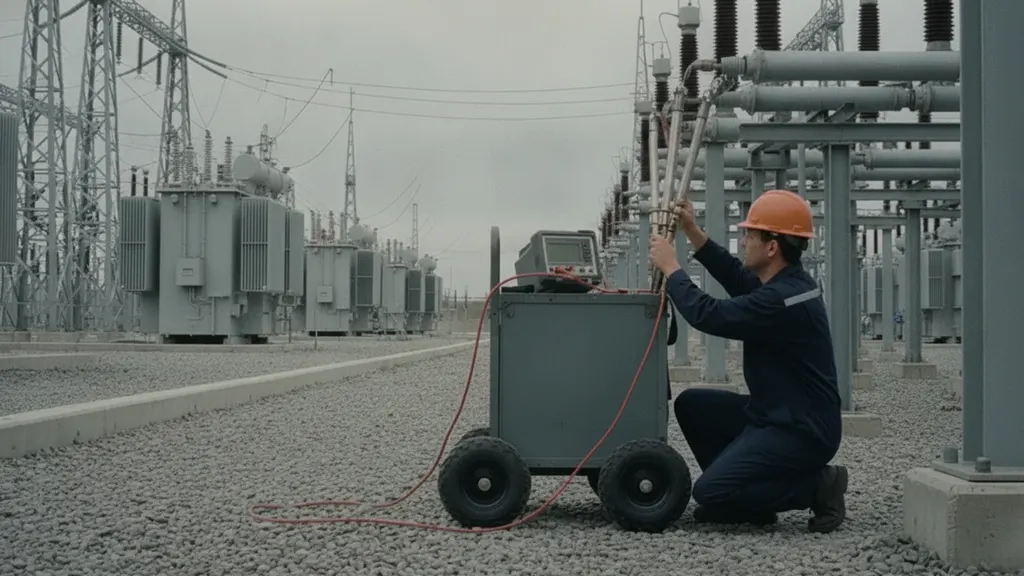
Which inverter, transformer, and cable conditions raise utility-scale solar harmonics
Five plant conditions account for most harmonic findings: a low short-circuit ratio at the interconnection, long medium-voltage cable runs, step-up transformers chosen on cost rather than impedance, inverter control firmware tuned for a different grid, and capacitor banks installed for power factor without detuning reactors.
Grid strength is the condition owners control least. Solar and storage make up a large share of new US generating capacity, as EIA electricity data shows, so more plants now share the same feeders and each addition changes the impedance every other plant sees. That is why utility-scale solar harmonics findings sometimes appear months after a clean commissioning test with nothing changed inside the fence. Control interaction between neighboring inverter fleets follows the same pattern described in our solar inverter anti-islanding protection guide.
- Short-circuit ratio below roughly 3 at the interconnection: control loops designed for a stiff grid begin interacting with the network and with each other.
- Long collector cable runs: added shunt capacitance moves the resonant frequency down toward orders the inverters already produce.
- Low-impedance step-up transformers: a cheaper unit passes more harmonic current through to the utility side.
- Firmware defaults from another market: current controller bandwidth and ride-through settings change the harmonic signature.
- Undetuned capacitor banks: power factor correction without a series reactor creates a sharp parallel resonance.
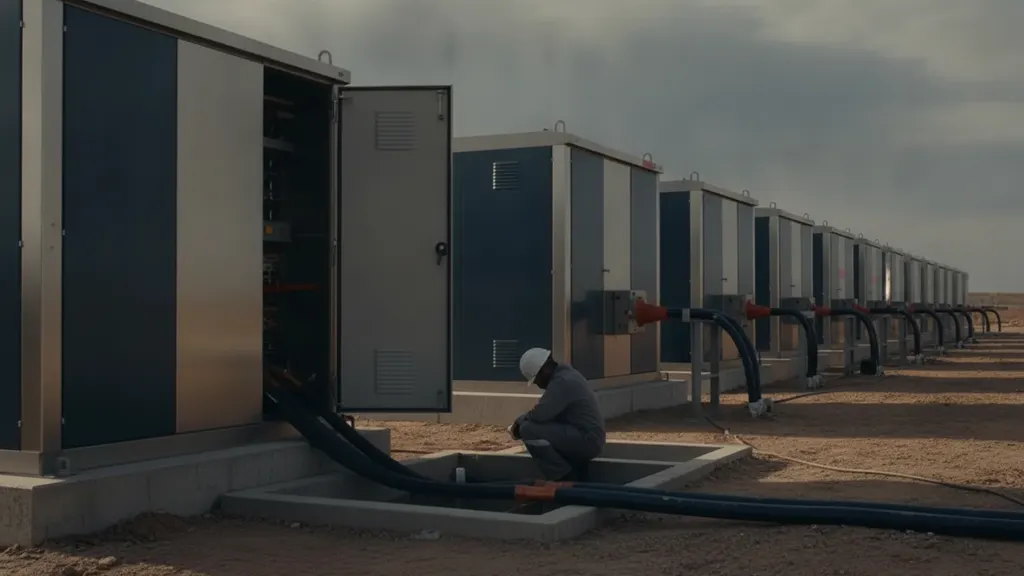
How to monitor and test utility-scale solar harmonics for compliance
Monitoring utility-scale solar harmonics well is mostly about the measurement chain, not the analyzer. Instrument class, current transformer bandwidth, aggregation interval and time synchronization decide whether a week of data survives a utility review. Set those before the first capture, because a flawed baseline cannot be rebuilt later.
- Specify a class A power quality instrument and keep its calibration traceable, which NIST measurement traceability guidance helps document.
- Check that the installed CTs and PTs have usable response above the 25th order, since revenue-class units often do not.
- Capture a full week at the point of common coupling and a parallel week at one inverter skid, time-aligned to GPS.
- Record background distortion before energization, or accept that the utility will attribute everything to the plant.
- Stream harmonic summary registers into SCADA alongside reactive telemetry, as covered in our inverter VAR dispatch guide, so trends stay visible between formal tests.
What corrective actions reduce utility-scale solar harmonics
Corrective action for utility-scale solar harmonics should follow cost order, cheapest and most reversible first. Control settings come before hardware, hardware before filters, and filters only after a frequency scan of the collector model shows where the resonance actually sits. Most findings close out without a filter purchase.
- Retune the inverter current controller and revisit the carrier frequency with the OEM before touching anything physical.
- Stagger carrier frequencies across inverter groups so sideband content does not add coherently at the collector bus.
- Review step-up transformer impedance and vector group, since a delta winding traps triplen current inside the plant.
- Add detuning reactors to any capacitor bank, or remove the bank if inverter reactive capability already covers the requirement.
- Size a tuned passive or active filter last, using the frequency scan, and follow the sequence in our IEEE 519 limits and filter design guide.
Frequently asked questions
Who is responsible for IEEE 519 compliance, the solar plant owner or the utility?
Both parties have a role, and the interconnection agreement decides the split. The utility owns voltage distortion at the point of common coupling because it controls system impedance and background distortion from other customers. The plant owner owns the current it injects. In practice the owner has to show its contribution stays inside the current limits, while the utility supplies a background distortion measurement taken before the plant energized. FERC interconnection procedures set the framework for that exchange. Without a pre-energization baseline, arguments about who caused a rise at the 5th order rarely get settled.
How long does a harmonic compliance measurement need to run?
Plan on a continuous week. IEEE 519-2022 bases its evaluation on time-varying statistics rather than single readings: daily 99th percentile very short time values of 3 seconds, and weekly 95th percentile short time values of 10 minutes. A seven-day window captures weekday and weekend load patterns on the utility side plus a full irradiance range on yours. Shorter captures are useful for troubleshooting, not for compliance evidence. Instrument class matters as much as duration, which is why most owners specify class A performance under the IEC power quality measurement standards.
Can an inverter pass factory testing and still fail IEEE 519 on site?
Yes, and it is the most common surprise in commissioning. Factory tests measure inverter current distortion into a stiff laboratory source. On site the inverter sees a collector system with real cable capacitance and a transformer with real impedance, so the same injected current produces a different voltage. That is why utility-scale solar harmonics are a system property rather than a product property. A low short-circuit ratio at the interconnection makes the mismatch worse, which is the behavior NERC inverter-based resource performance guidance keeps pointing at for weak-grid plants.
What is the difference between THD and TDD in IEEE 519?
THD, total harmonic distortion, expresses harmonic content as a percentage of the fundamental at the moment of measurement. TDD, total demand distortion, expresses harmonic current as a percentage of maximum demand load current. The distinction matters for solar because a plant running at a small fraction of rated output has a small fundamental, so current THD can read high while the actual harmonic amperes are low. Referencing demand keeps the evaluation honest across the irradiance range. The IEEE 1547-2018 interconnection standard takes the related approach of limiting distortion against the rated current of the resource itself.
Where should a harmonic filter be installed in a solar plant?
Place it where the harmonic current actually flows, usually at the inverter skid or the medium-voltage collector bus, rather than bolted onto the point of common coupling. A filter at the boundary lowers the measured number but leaves the resonant loop inside the plant intact, so cable and transformer heating continues. Tuned passive filters also shift system resonance, so every candidate location needs a frequency scan of the collector model before procurement. Collector modeling practice of this kind is covered in NREL grid integration research, and the same model supports later studies.
How often should a utility-scale plant repeat harmonic testing?
Retest after any change that moves the impedance or the control response: inverter firmware updates, transformer replacement, collector circuit additions, capacitor bank work, or a new neighboring plant on the same feeder. Beyond those triggers, an annual week-long capture is a reasonable baseline because utility-scale solar harmonics drift as equipment ages and as the surrounding network changes. Many owners now stream harmonic summary registers into SCADA so the annual capture confirms a trend rather than discovering one. Long-term fleet monitoring work is published by the DOE Solar Energy Technologies Office.