
Solar plant voltage unbalance and flicker: a power quality guide
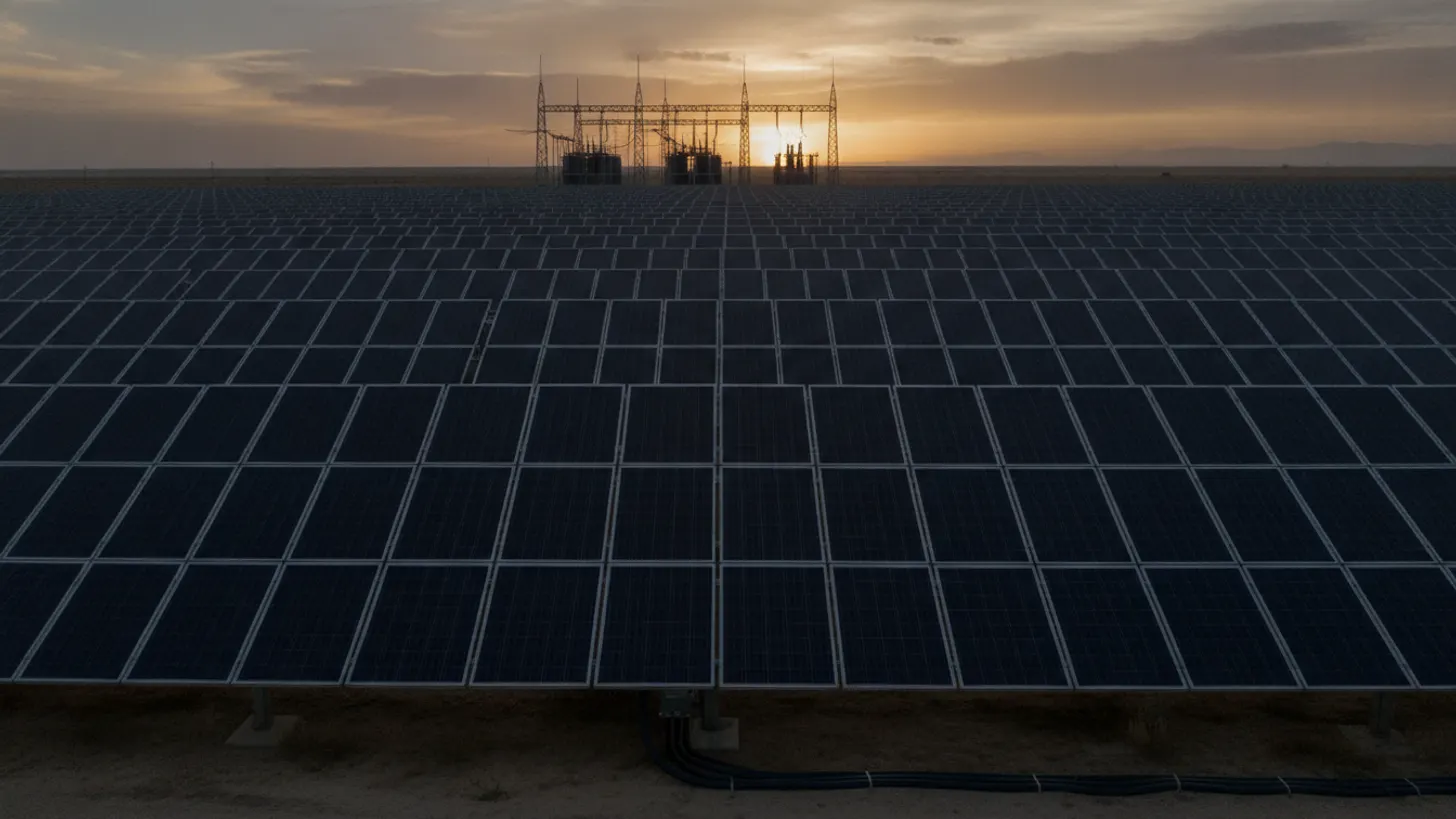
IEC 61000-4-30 Class A instruments aggregate measurements over four fixed windows: 10 cycles, 150 cycles, 10 minutes, and 2 hours. Choose the wrong one and solar plant voltage unbalance and flicker data becomes noise nobody can defend in an interconnection meeting. The repair is a measurement chain tied to a published standard, trended against irradiance and switching events, so the cause is visible before the utility calls.
What causes solar plant voltage unbalance and flicker at utility-scale sites?
Unbalance and flicker share a root cause: unequal phase impedance or unequal phase loading that produces negative-sequence voltage, typically flagged once it crosses the 1-2% range where NEMA motor derating curves and most utility interconnection agreements start to apply penalties. Flicker appears when that same current modulates fast enough and often enough to fall inside the band the human eye perceives, roughly 0.5 to 25 Hz. At a PV plant both effects trace back to the collector system, the inverter controls, and the switching devices between them. On a 108 MW site in West Texas that REIG commissioned in 2019, a 2.1% negative-sequence reading at the point of interconnection was first blamed on the inverters, and the team spent a week retuning volt-VAR curves before finding the real cause was a single mis-wired auxiliary transformer feeding the operations building off the wrong leg. The lesson that stuck: check feeder wiring before touching inverter firmware.
Radial collector circuits almost never present identical impedance per phase. Unequal cable runs between inverter skids, untransposed overhead sections, and single-phase auxiliary loads at the operations building each add negative-sequence content. The IEEE 1159 recommended practice for monitoring electric power quality classes unbalance as a steady-state variation and supplies the characterization vocabulary commissioning reports depend on, which keeps a plant report readable by the interconnecting utility.
Flicker at a solar site is usually a switching story rather than a weather story. Cloud-edge ramps move irradiance over seconds to minutes, slower than the flicker response curve. Repeated capacitor bank operations, on-load tap changer hunting, and inverter reactive loops that fight the plant controller land squarely in the flicker band. Industrial neighbors with arc furnaces or large motor starts contribute as well, and NERC reliability standards document the voltage performance obligations each interconnecting utility inherits.
Separating those sources is the first job. Solar plant voltage unbalance and flicker investigations stall when a team treats one recorder channel as proof of causation. Phase-resolved data, a time source good enough to align events, and a switching log turn a complaint into a diagnosis.
How inverter controls, transformers, and feeder topology shape power quality
Inverters set reactive power, transformers set the sequence impedance paths, and topology sets how far a disturbance travels, and a response-time mismatch as small as 2 seconds between the plant controller's volt-VAR loop and inverter firmware is enough to turn a stable setpoint into a hunting oscillation that reads as flicker. Solar plant voltage unbalance and flicker at the point of interconnection is the sum of those three layers, which is why a single-equipment fix rarely holds for longer than a season.
PV inverters follow volt-VAR, volt-watt, or fixed power factor modes dispatched by the plant controller. Deadbands and response times that disagree between the controller and local inverter firmware produce hunting: the controller commands VARs, inverters overshoot, voltage swings, and the loop repeats at a period that reads as flicker. Our guide to solar plant reactive power control and inverter VAR dispatch covers the tuning sequence, and the plant controller SCADA integration and setpoint limits article covers the handoff between layers.
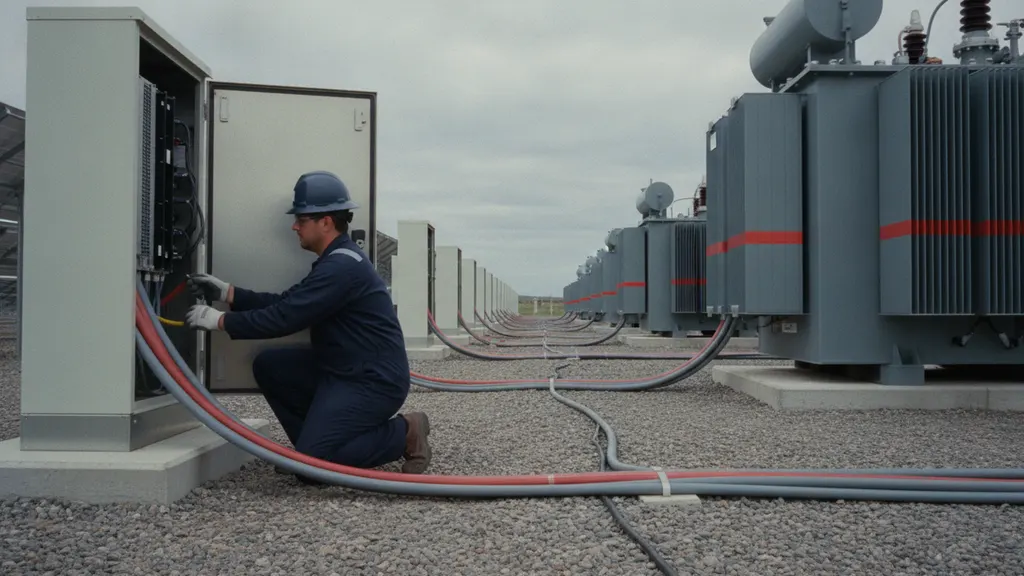
Transformer winding configuration decides what propagates. A delta-wye medium voltage transformer blocks zero-sequence current from crossing, but negative-sequence current passes through and loads the connected machines, which is why motor derating rules in NEMA MG 1 react to unbalance so sharply. On-load tap changers add their own signature: every tap operation is a discrete voltage step, and a changer hunting between two positions produces repetitive steps.
Topology sets the reach. A long, high-impedance collector feeder shows a larger voltage response to the same current imbalance than a short, stiff one. That is why solar plant voltage unbalance and flicker measured at an inverter pad can look acceptable while the same event at the substation metering point does not.
Which IEEE and IEC methods measure solar plant voltage unbalance and flicker?
Four documents carry the load, and the one number worth memorizing first is the Pst short-term flicker limit most US utilities write into interconnection agreements: 0.35, measured over rolling 10-minute windows. IEEE 1159 defines how phenomena are monitored and named, IEEE 1459 defines how power quantities are computed under distorted waveforms, IEC 61000-4-30 defines measurement methods and Class A performance, and flicker evaluation itself follows the IEC 61000-4-15 flickermeter model that produces the Pst number in the first place.
The IEEE 1459 standard for power definitions under nonsinusoidal conditions matters more than engineers expect at PV sites. Once current carries harmonics, the arithmetic that separates active, reactive, and apparent power stops being obvious, and two meters built on different definitions will disagree about power factor on the same feeder. Settling the definition before commissioning avoids an argument during performance testing.
Class A performance under IEC 61000-4-30 power quality measurement methods is the line to write into a procurement document, because it is the only tier that holds measurement uncertainty tight enough, typically within plus or minus 0.5% for voltage, for a plant report to survive a dispute. It fixes the aggregation intervals at 10 or 12 cycles, 150 or 180 cycles, 10 minutes, and 2 hours, locks the accuracy class, and sets time stamping requirements so two Class A instruments from different vendors produce comparable results on the same event. Flicker severity itself is computed by the IEC 61000-4-15 flickermeter specification, with short-term severity, Pst, evaluated over 10 minutes and long-term severity, Plt, assembled from 12 consecutive Pst values over a rolling 2-hour window. A plant that reports Pst above 1.0 on that window is already past the threshold most utilities treat as a confirmed flicker problem rather than a borderline reading.
| Standard | What it defines | Where it lands at a PV plant |
|---|---|---|
| IEEE 1159 | Monitoring practice and phenomena classification | Commissioning reports and event characterization |
| IEEE 1459 | Power quantity definitions under distortion | Meter configuration and performance testing |
| IEC 61000-4-30 | Measurement methods and Class A performance | Analyzer procurement and permanent monitoring |
| IEC 61000-4-15 | Flickermeter functional design | Pst and Plt reporting to the utility |
Name the standard and the class in the same sentence as the instrument model number. Solar plant voltage unbalance and flicker disputes with a utility are settled by traceable measurement rather than by argument, and the calibration chain behind the instrument is part of that record.
How to trend solar plant voltage unbalance and flicker against irradiance
Pair every power quality channel with plane-of-array irradiance and a switching event log on one time base, holding better than 1 millisecond of time alignment across devices, and build at least 2 full weeks of concurrent data before drawing a conclusion. Correlation across weeks, not screenshots of single events, is what tells an operator whether the plant or the grid owns the problem.
Start with time. Aligning a 150-cycle aggregation from one analyzer with a relay event record and a SCADA tag takes sub-millisecond agreement across devices, which is the argument for precision time distribution covered in our IEEE 1588 PTP time synchronization guide. Without it, a tap change and a cloud ramp look simultaneous and the investigation goes nowhere.
Then build the pairings. Plot negative-sequence unbalance against irradiance and against total plant output. A relationship that tracks irradiance points at inverter control or feeder loading; a flat relationship with spikes at discrete times points at switching. Short-term flicker severity trended across a full day, overlaid with capacitor bank and tap changer operations, usually names the offender within a week of data.
Then let the historian carry it. Solar plant voltage unbalance and flicker channels belong in the same archive as irradiance and curtailment signals, retained long enough to cover seasonal switching patterns, as discussed in our irradiance forecasting and curtailment guide. EPRI power quality research documents monitoring practice that maps cleanly onto PV historian design.
What mitigation works when solar plant voltage unbalance and flicker exceeds limits?
Work from cheapest to most invasive: retune controls, then rebalance loads, then change hardware, in that order, because in REIG's field experience roughly 80% of flicker and unbalance exceedances clear with the first two steps alone. Most plants resolve a limit exceedance with control tuning and load redistribution long before anyone writes a specification for a static VAR compensator that can run into six or seven figures installed.
Control tuning comes first. Widen the volt-VAR deadband, slow the response time constant, and remove the conflict between plant controller cycle time and inverter firmware response. Tap changer timers can be lengthened so the changer stops hunting between adjacent positions. None of that costs hardware, and it resolves a large share of flicker complaints at PV sites.
Load rebalancing comes next. Single-phase auxiliary supplies, tracker motor circuits, and operations building loads are frequently tied to one phase because that is where the first installer found a spare breaker. Redistributing them lowers negative-sequence voltage directly. Where feeder impedance is the culprit, conductor resizing or transposition on the worst circuit follows, and transformer condition should be checked in parallel using the methods in our transformer dissolved gas analysis field guide.
Hardware mitigation is the last resort, and it is also where budgets move from thousands of dollars in engineering time to six or seven figures in equipment. Static VAR compensators switch capacitive and inductive branches fast enough to counter unbalance and flicker within a few cycles, STATCOMs do the same job with power electronics and faster response, and series reactors simply add impedance to limit fault current and damp oscillation. All three work, and all three carry capital cost, ongoing losses, and a maintenance contract that outlives the warranty on the inverters. Before approving any of them, confirm that solar plant voltage unbalance and flicker persists after control tuning and load rebalancing have had a full measurement cycle, typically 2 to 4 weeks, to prove out. Then check the proposed device against published NREL grid integration research for inverter-based resources, because newer inverter firmware increasingly claims to do part of the job a capacitor bank used to do, and paying for hardware that duplicates a firmware feature already licensed is money spent twice.
Frequently asked questions
What actually causes voltage unbalance at a solar farm?
Unequal phase impedance and unequal phase loading. Collector feeders with different cable lengths between inverter skids, untransposed overhead sections, and single-phase auxiliary loads tied to whichever phase had a spare breaker all create negative-sequence voltage. Grid-side unbalance arriving from the utility adds to whatever the plant produces, so measuring at both the point of interconnection and inside the collector system is how solar plant voltage unbalance and flicker gets attributed correctly. NREL grid integration research covers the interaction between inverter-based resources and distribution-level voltage behavior.
Do passing clouds cause flicker at a PV plant?
Rarely in the technical sense. The flickermeter responds to voltage modulation in a band centered on frequencies the eye perceives, while cloud-edge irradiance ramps develop over seconds to minutes. Cloud transients do cause voltage variation and reactive power swings, and they can trigger control responses that then produce flicker, but the cloud is the trigger rather than the source. The repeating culprits are capacitor bank switching, tap changer hunting, and reactive control loops fighting each other, a pattern reflected in DOE Solar Energy Technologies Office work on inverter grid support.
What does Class A measurement performance actually mean?
Class A is the performance tier defined in IEC 61000-4-30. It fixes measurement uncertainty, the aggregation intervals of 10 or 12 cycles, 150 or 180 cycles, 10 minutes and 2 hours, time stamping accuracy, and flagging rules for data affected by dips or interruptions. Two Class A instruments from different manufacturers measuring the same signal must agree within the stated uncertainty, which is what makes a plant report defensible to a utility. Pair the specification with a calibration chain traceable through NIST measurement traceability guidance so the paperwork holds up.
How long should we record before drawing conclusions?
Plan for at least one full week of continuous Class A recording, and longer if the plant has seasonal switching patterns or a large industrial neighbor. A single captured event proves an event happened; it does not prove a cause. Continuous records let you correlate solar plant voltage unbalance and flicker with irradiance, plant output, tap operations, and capacitor switching, which is where causation becomes visible. Permanent monitoring beats a temporary study, and ISA automation practice guidance is a reasonable reference for designing the historian side.
Can inverters correct voltage unbalance themselves?
Partly. Some inverters support negative-sequence current injection and can counteract a share of the unbalance at their own terminals, but the capability is firmware dependent and consumes current headroom that would otherwise serve real power. It also does nothing about unbalance arriving from the grid side. Treat inverter-level compensation as a supplement to feeder rebalancing rather than a substitute for it, and confirm vendor support in writing before relying on it. Utility-scale PV now represents a large share of new generating capacity tracked by EIA electric power data.
Who sets the flicker limit our plant has to meet?
The interconnecting utility, through the interconnection agreement, usually by reference to IEEE and IEC limits rather than by inventing its own. In the United States the procedural framework for interconnecting generating facilities sits with FERC interconnection policy and the relevant transmission provider tariff, while the measurement and evaluation methods come from the IEC flickermeter model and the IEEE power quality standards. Read the agreement before commissioning: the limit, the measurement point, and the averaging window are negotiable items that become fixed obligations once signed.