
Solar module electroluminescence testing: hotspot and crack guide
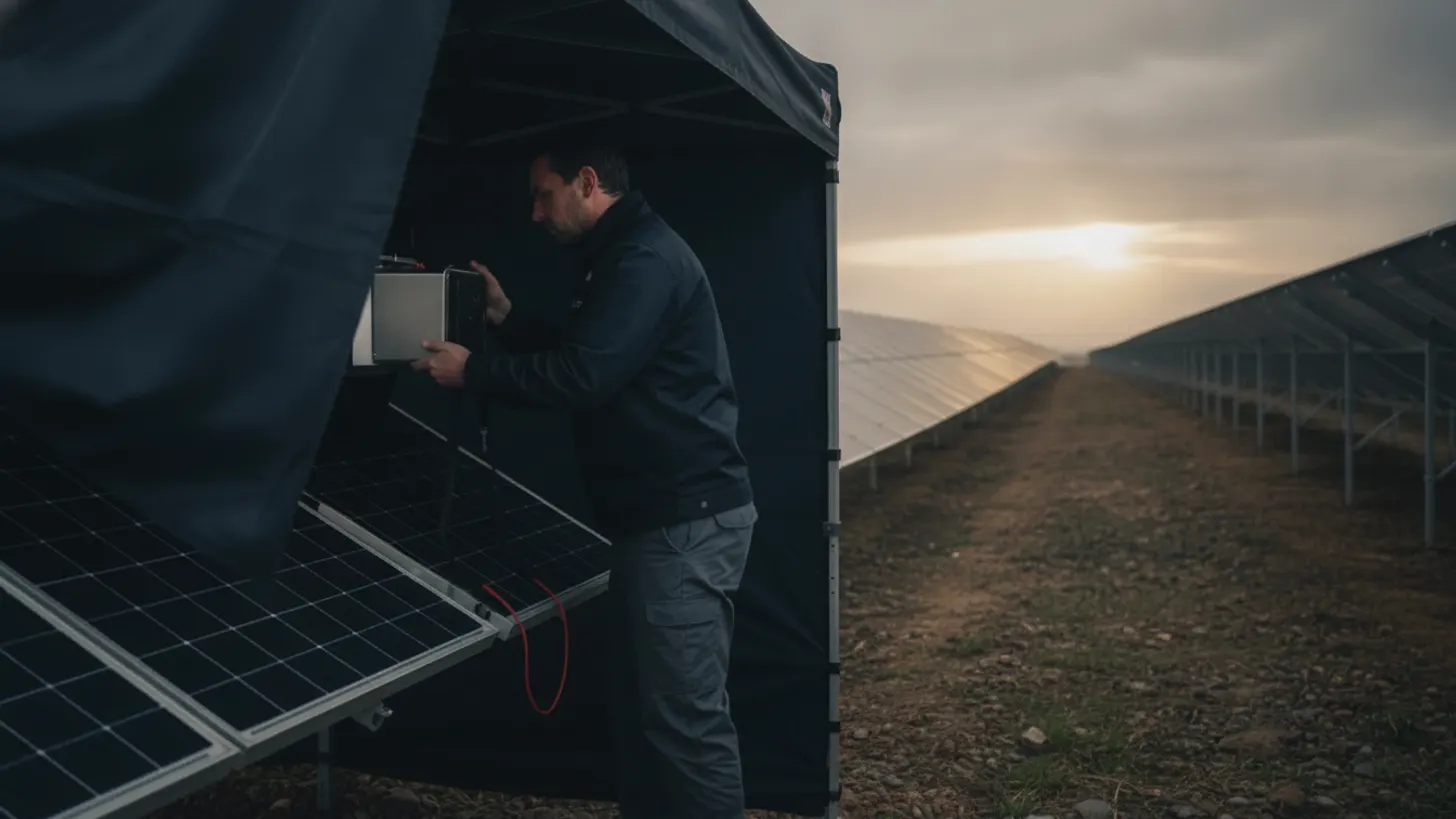
Two IEC documents govern how a cracked cell gets found: IEC TS 60904-13 for electroluminescence imaging and IEC 62446-3 for outdoor infrared thermography. Solar module electroluminescence testing sits upstream of both thermal and IV diagnostics because it shows structural damage before that damage turns into a hotspot. For utility-scale owners, the timing decides whether a defect becomes a warranty claim with evidence behind it or a production loss nobody can attribute.
What defects does solar module electroluminescence testing reveal?
Solar module electroluminescence testing pushes current through a module in the dark and photographs the near-infrared light the silicon gives back. Regions that carry current glow. Regions that do not stay black. That contrast exposes cell cracks, isolated cell fragments, broken interconnect ribbons, and finger interruptions that a visual walkdown will never show.
Under forward bias, carriers recombine and emit photons peaking near 1150 nm, past the response of an unmodified camera. Factory and field rigs use InGaAs sensors or cooled silicon CCDs with the infrared cut filter removed. Image brightness tracks local current density, so an EL frame is a map of electrical participation rather than a photograph of surface damage. Module reliability work published by the NREL photovoltaic research program treats that map as the first screen for cell-level damage, and the capture and reporting method is set out in IEC TS 60904-13, published by the International Electrotechnical Commission.
- Cell cracks: dark lines that either still pass current across the fracture or isolate the silicon on one side of it.
- Inactive areas: fully dark regions where a fragment has lost its connection to the finger grid.
- Broken interconnects: a half cell, a full cell, or an entire substring dropping out at once.
- Finger interruptions: striped darkening running parallel to the fingers, usually a metallization or soldering problem.
- Potential-induced degradation: darkened cells clustered at the frame edge of a string, worst at the most negative module.
Emission falls off steeply outside the silicon band edge, which is why detector choice decides image quality more than camera resolution does.
When should EPCs schedule solar module electroluminescence testing?
Four points on a utility-scale build return their cost: factory sampling before the container seals, arrival inspection after transport, a post-installation sample once modules are clamped and wired, and a targeted campaign whenever SCADA trends show a string or combiner sitting below its neighbors.
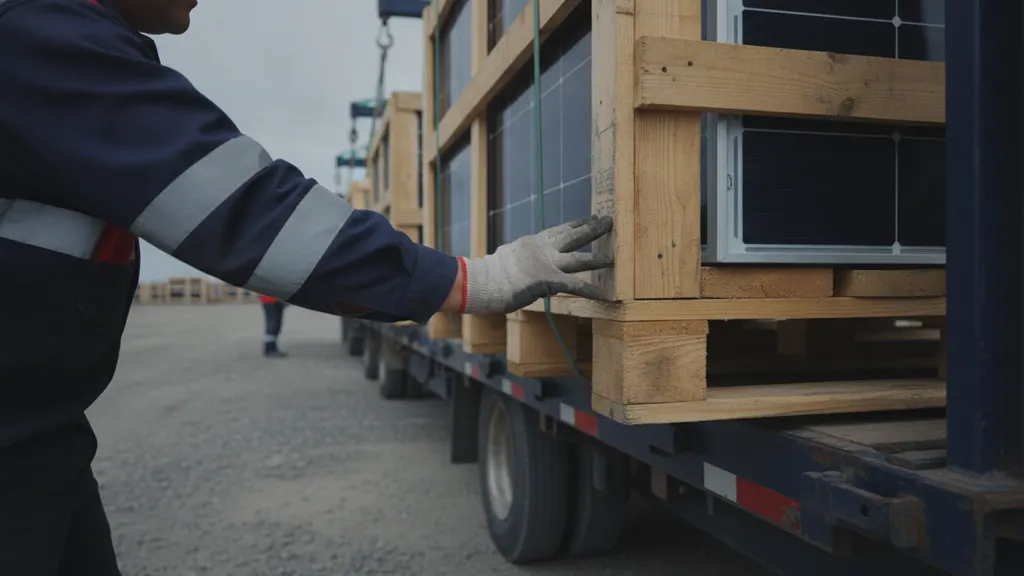
Transport does much of the damage people later blame on manufacturing. Stacked pallets, road vibration, and rough unloading produce cracks that leave no mark on the glass. Arrival inspection carries weight in a claim because it separates factory defects from handling damage while the carrier and the supplier are both still reachable. Module quality guidance from the Department of Energy Solar Energy Technologies Office and from the Solar Energy Industries Association both point owners toward documented incoming inspection rather than post-COD argument.
After commissioning, the trigger is data. String current deviation, a shaded-looking IV curve on a clear day, or an inverter channel trending down against its twins all justify a field campaign, and solar module electroluminescence testing is the step that turns a trend into a named defect. Our guide to solar predictive maintenance for PV plants covers how those SCADA signals get built. Hail, high wind, and seismic events warrant a sample campaign regardless of what the meters show, because crack propagation appears in images long before it appears in production data.
Field EL means energizing modules at night with an external DC supply, which is live DC work. Follow the plant electrical safety program and the requirements published by the Occupational Safety and Health Administration; our solar plant arc flash analysis field guide covers the boundary calculations.
How cracks, inactive areas, and cell interruptions appear in EL images
Reading an EL frame is pattern recognition against three questions: is the dark feature a line, an area, or a stripe; does it isolate silicon from the finger grid; and does it repeat in the same position across modules, which points at process or handling rather than chance.
Cracks print as thin dark lines. A hairline that still passes current across the fracture dims the cell slightly and may never cost measurable power. A crack that cuts a fragment off from the busbar produces a sharply bounded dark wedge, and that area stops contributing for the life of the module. Dendritic patterns radiating from one point suggest an impact. Parallel cracks running across several cells in a line suggest clamping force or a pallet strap.
Interconnect failures look different: half a cell or a whole substring goes dark at once, with a clean boundary at the ribbon. Finger interruptions produce evenly spaced dark bands. Shunts read as local bright or dark spots depending on bias, which is why solar module electroluminescence testing is run at more than one injection current. Low current near 10 percent of Isc brings out series resistance and shunt behavior; full Isc brings out cracks and inactive areas.
How to confirm solar module electroluminescence testing findings with IV curves and thermography
Solar module electroluminescence testing proves a module is electrically nonuniform under controlled forward bias. It does not prove how much power that costs, or whether the defect is heating, and treating EL alone as a replacement trigger is a mistake REIG came close to making on a 128 MW project in Pecos County, Texas, in 2023. Post-installation EL sampling across 2,400 modules there turned up an 8.1 percent rate of fractures bright enough to flag, a number that looked alarming until IV tracing showed most of those cracks were still passing current and costing under 0.3 percent of string output, and thermal scans confirmed only eleven modules were actually running hot. Without that IV and thermography follow-up, the EPC would have swapped close to 200 modules on EL evidence alone, a replacement bill north of $38,000 in hardware and labor for defects that were not costing the owner measurable production. Pair every EL finding with an IV trace for the power number and an infrared scan for thermal risk before anyone writes a replacement order.
IV curve tracing quantifies the loss: reduced Isc points at inactive area, a sagging knee points at series resistance, a sloped plateau points at shunting. Field methods are covered in our string IV curve tracing field guide. Infrared scanning finds the cells already running hot, and IEC 62446-3 addresses outdoor infrared thermography of PV modules and plants, including methods for identifying thermal anomalies. Instrumentation and measurement practice references are maintained by the IEEE standards program and the National Institute of Standards and Technology.
| Method | What it shows | Test condition | Limit |
|---|---|---|---|
| Electroluminescence imaging | Cracks, inactive areas, broken interconnects, finger interruptions | Darkness, module under forward bias | Gives no direct power figure |
| IV curve tracing | Power loss, series resistance, shunting | Stable irradiance, known cell temperature | String level, does not localize the cell |
| Infrared thermography | Hotspots, bypass diode faults, hot cells | Daylight under load, per IEC 62446-3 | Misses cracks that are not yet heating |
A hotspot with no matching EL defect usually means soiling, shading, or a diode. A crack with no thermal signature and no IV penalty is a watch item, not a replacement. Ranking findings through all three methods keeps module swap counts defensible when an independent engineer reviews the file, and the resulting defect list also feeds the combiner-level review described in our NEC 690 combiner box design guide. Run solar module electroluminescence testing first, then measure, then decide.
Acceptance criteria and records from solar module electroluminescence testing that support warranty claims
Warranty language promises power, not image quality. If the supply agreement does not define which EL features count as a defect and how many are allowed per sample, that negotiation happens after the modules are on racks, where the owner has no use left.
Write the criteria in before the first container ships: a crack classification scheme tied to the feature definitions in IEC TS 60904-13, a lot definition and sample size, pass or fail counts per lot, the injection currents and exposure conditions used for capture, and who pays to retest a failed lot. On REIG's own supply contracts, a lot is usually one truckload of 600 to 900 modules, with a 2 percent reject threshold before the full lot gets resampled at the supplier's cost. Reliability guidance from the Electric Power Research Institute is a reasonable reference when deciding what counts as a reject.
Records decide claims. For every module tested, keep the serial number read from both the label and the EL frame, the raw unprocessed image file, injection current, module temperature, camera and lens, operator, timestamp, and chain of custody. Link that file set to the asset register and to the SCADA tag for the string, so a production argument can be reconstructed years later. A claim package of processed images with no capture metadata is easy for a supplier to dispute, and evidence built during solar module electroluminescence testing loses its value the moment nobody can prove how it was captured.
Frequently asked questions
Can electroluminescence testing be done in the field, or does it need a lab?
Both work. Factory and lab rigs give the cleanest images because the module sits in a dark chamber at a known temperature with a calibrated supply. Field work is done at night, module by module or string by string, with a portable DC source driving forward bias and a cooled infrared-sensitive camera on a frame or a drone mount. Field images carry more noise and need careful exposure control, but they are good enough to classify cracks and inactive areas. Solar module electroluminescence testing in the field is how most post-event and production-loss investigations get run, and the NREL module reliability program documents both approaches.
Do all cell cracks cause power loss?
No. A crack that still passes current across the fracture may cost almost nothing at the moment it is imaged. The ones that matter isolate silicon from the finger grid, which shows as a sharply bounded dark area, and that fraction of the cell stops producing for the life of the module. The risk with a benign crack is propagation: thermal cycling, wind load, and snow load can turn a hairline into an isolating fracture over several seasons. That is why findings get ranked and rechecked rather than replaced on sight. PV reliability work published by the Department of Energy solar program tracks this progression.
What is the difference between EL imaging and infrared thermography?
EL imaging reads light the silicon emits when current is pushed into the module in the dark, so it maps electrical participation at cell resolution and finds damage before it heats. Infrared thermography reads heat the module emits in daylight under load, so it finds defects already dissipating power: hotspots, failed bypass diodes, and hot cells. IEC 62446-3 addresses outdoor infrared thermography of PV modules and plants, including methods for identifying thermal anomalies, and is published by the International Electrotechnical Commission. Use EL to locate the defect and thermography to judge how urgent it is.
How many modules should we sample on a utility-scale project?
There is no universal number. Sampling is defined by lot in the supply agreement: a lot size tied to a shipment or production batch, a sample drawn from that lot, and a pass or fail count agreed before delivery. Owners buying from several factories usually sample per factory and per production window rather than per project, because defect modes cluster by line and by build date. Increase the sample when a lot fails, when transport was rough, or when a weather event hits the site. Module quality guidance from the Solar Energy Industries Association research library points toward contractual sampling rules set before shipment.
Will solar module electroluminescence testing void the module warranty?
Not in normal practice. Imaging at or below the module rated short-circuit current is non-destructive, and the method is standardized in IEC TS 60904-13. The caution is procedural rather than technical: some supply agreements restrict who may apply external bias, require supplier notification, or set conditions on disassembly and relabeling. Read the warranty clause before a campaign, keep injection current at or below rating, and log the conditions used. If a supplier disputes a claim later, documented and compliant test conditions are what keep the images admissible. Reliability guidance from the EPRI research program covers test documentation expectations.
How long should we keep EL images and test records?
Keep them for the full warranty term of the modules, which on utility-scale supply agreements runs for decades, and keep raw files rather than processed exports. A claim package built from compressed images with no capture metadata is easy for a supplier to dispute. Store serial number, injection current, module temperature, camera, operator, timestamp, and chain of custody alongside each frame, and link the record to the asset register entry and the string tag in SCADA. Measurement traceability and metadata guidance from the National Institute of Standards and Technology is a useful model for structuring that record.