
Solar Data Acquisition System (DAS): Sensor Map + Data Flow
Solar Data Acquisition System (DAS): Sensor Map + Data Flow
A solar data acquisition system (DAS) is only “done” when the data is trustworthy end-to-end: sensors are installed correctly, signals are scaled properly, communications are reliable, and the final values show up in the right places for commissioning, performance analysis, and long-term operations.
This guide is for utility-scale solar owners/operators, EPCs, commissioning leads, and O&M teams who want a practical sensor map and a clear understanding of how data flows from the field into SCADA, dashboards, and reports—plus the validation steps that prevent the most common data-quality problems.
What a solar DAS is (and what it isn’t)
A Data Acquisition System (DAS) collects measurements from field devices (sensors, meters, inverters, trackers, weather stations) and stores and forwards them so people and software can visualize and analyze performance. It answers: “What is happening?”
SCADA (Supervisory Control and Data Acquisition) includes data acquisition but adds supervisory control and grid/utility-driven functions (for example, setpoints, curtailment, voltage/reactive power control, and interconnection requirements). It answers: “What is happening, and what do we need to control?”
In real projects, DAS and SCADA often share sensors, communications networks, and data pathways. The key is to define what must be available for COD, what is required by the utility, and what is needed for performance and O&M.
Sensor map: what to measure on a utility-scale solar site
The “right” sensor map depends on plant size, technology (fixed-tilt vs trackers, bifacial vs monofacial), interconnection requirements, and how the asset will be operated. But most sites share a core set of measurements.
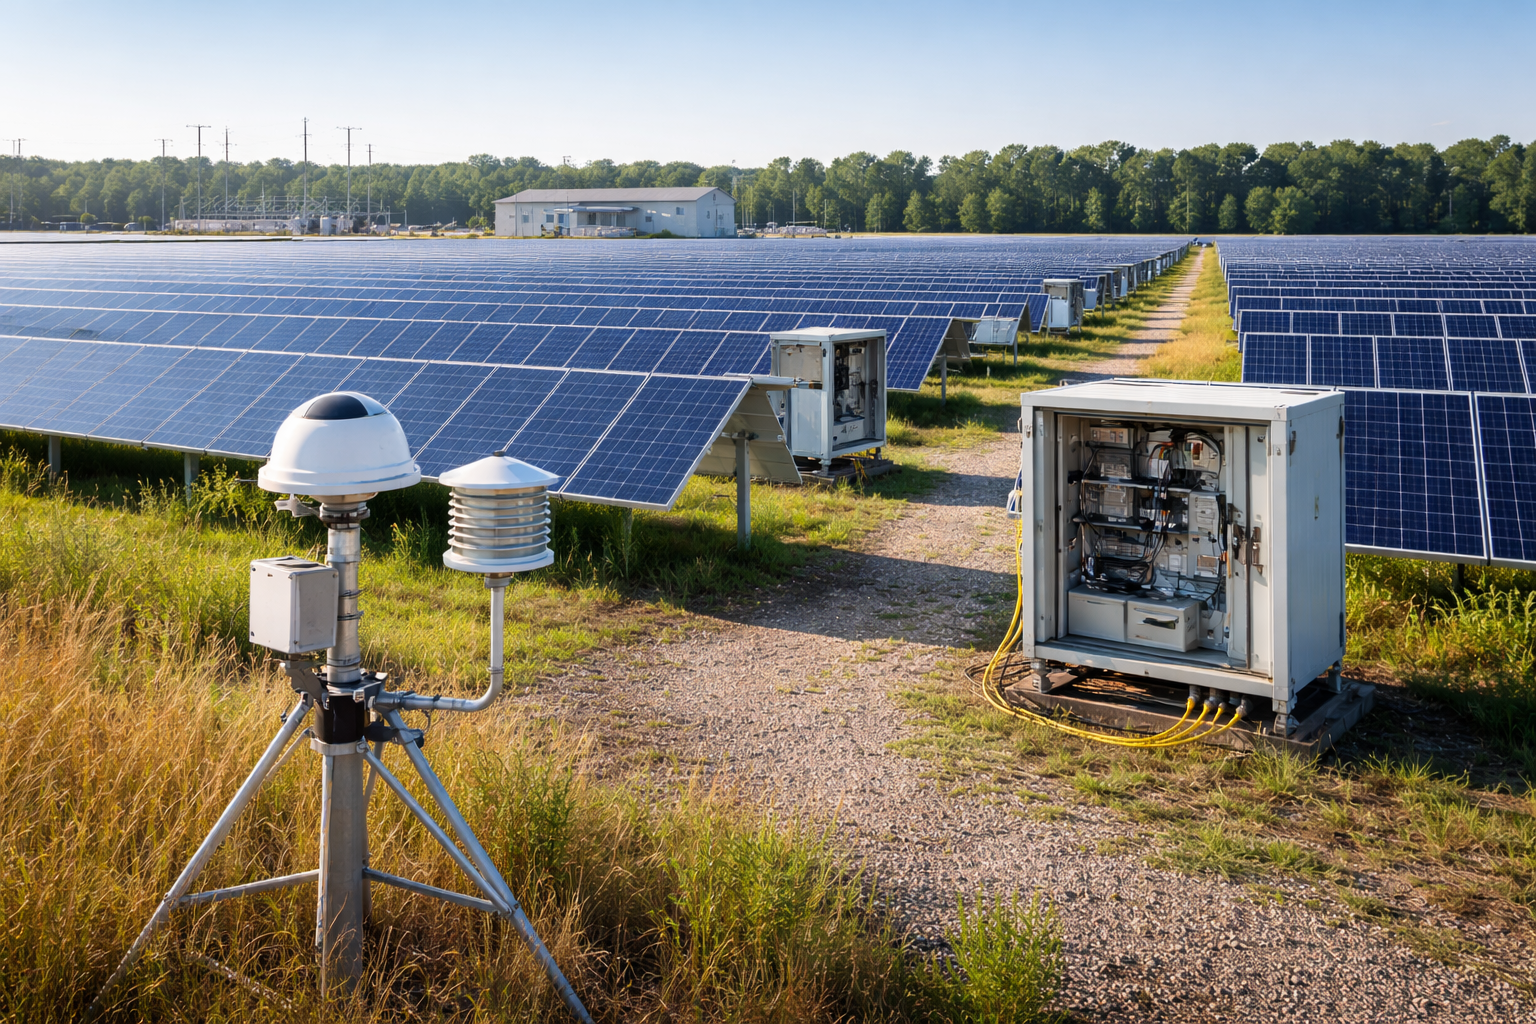
1) Meteorological (MET) station and irradiance sensors
MET and irradiance measurements are foundational because they help separate “resource” from “equipment.” If energy is down, you need to know whether irradiance dropped or the plant underperformed.
- Pyranometer (GHI and/or POA): Measures solar irradiance in W/m². Commonly deployed as Global Horizontal Irradiance (GHI) and Plane of Array (POA). Some sites use multiple POA sensors across the array.
- Reference cell: A calibrated PV cell used as an irradiance reference that often tracks PV response more directly than a thermopile pyranometer in certain operating contexts. Commonly used for performance ratio (PR) and operational comparisons.
- Rear POA (RPOA) for bifacial: Measures irradiance on the back side to help quantify albedo and bifacial gain.
- Ambient temperature and module temperature: Important for expected power modeling and troubleshooting thermal derates.
- Wind speed/direction and other site-specific weather sensors (optional): Useful for thermal behavior, soiling correlations, and extreme weather awareness.
Placement and installation quality matter. A perfectly accurate sensor in the wrong location (or installed at the wrong tilt, poorly leveled, or dirty) produces misleading data.
2) Electrical production and revenue-grade metering
At minimum, you need values that reconcile with what matters financially and contractually.
- Revenue meter (as specified by the utility/market): Typically the settlement point for energy delivery.
- Plant-level and feeder-level meters (as designed): Used to understand losses, validate interconnection requirements, and isolate issues.
- Power quality measurements (where required): Depending on interconnection and compliance obligations.
3) Inverter and power conversion data
Inverter data is the heartbeat of day-to-day operations. Even if you don’t trend every possible point at high frequency, you need enough to identify failures, derates, and communications gaps quickly.
- AC power, energy counters, DC voltage/current (as available), and operating state
- Faults/alarms and key status bits
- Temperatures, internal diagnostics, and availability indicators (selectively trended)
4) Tracker and array controls (where applicable)
For single-axis tracking sites, tracker data can explain production deltas that look like “mystery” underperformance.
- Tracker position / stow status
- Tracker controller alarms, wind stow events
- Row or zone-level status (depending on architecture)
5) Substation and interconnection monitoring (SCADA-adjacent)
Even if your DAS scope is “monitoring only,” the site’s SCADA requirements are often driven by grid interconnection. Data points typically include substation breaker status, protective relay data, and utility interface signals as specified.
Quick reference: typical DAS sensor map
| Category | Common signals | Why it matters | Common failure modes |
|---|---|---|---|
| Resource (MET) | POA/GHI irradiance, ambient temp, module temp, wind | Separates “sun” from “system” and supports PR analysis | Dirty sensors, wrong tilt/level, bad scaling, wrong time sync |
| Electrical (plant) | Revenue meter, feeder meters, plant power/energy | Financial reconciliation and compliance reporting | Wrong CT/PT ratios, Modbus mapping errors, dropped comms |
| Inverters | Power, status, alarms, key diagnostics | Fast fault isolation and availability tracking | IP conflicts, wrong register maps, polling overload |
| Trackers | Position, stow, faults, comms health | Explains production deltas and mechanical/electrical issues | Addressing issues, gateway failures, inconsistent firmware maps |
| Network health | Switch ports, fiber links, gateway status (where available) | Reduces downtime by finding comms root cause faster | Bad terminations, high loss, water intrusion, misconfigured VLANs |
Data flow: from sensors to dashboards (what should happen)
Most “DAS problems” are really “data flow problems.” A signal can be correct at the sensor but wrong at the historian because scaling was applied twice, or because a gateway swapped byte order, or because the point name was mapped incorrectly.
Step-by-step data flow (typical architecture)
- Field measurement: A sensor (for example, pyranometer) produces an analog signal (mV or 4–20 mA) or digital output.
- Local signal conditioning and input: A datalogger, RTU, PLC, or remote I/O module reads the signal and applies scaling (engineering units like W/m² or °C).
- Protocol conversion / device communications: Field devices communicate via protocols such as Modbus RTU (serial) or Modbus TCP (Ethernet). Gateways may convert serial-to-Ethernet or normalize data.
- Site network transport: Managed switches, VLANs/subnets, and fiber or copper transport move data across the site LAN. For utility-scale sites, fiber is common for distance and noise immunity.
- SCADA/DAS server ingestion: A SCADA or DAS platform polls devices or subscribes to data, then stores values in a historian/database and makes them available to dashboards and reports.
- Visualization and reporting: Operators view dashboards, alarms, and trends; asset managers export data; performance engineers calculate PR and analyze losses.
Where data quality usually breaks down
- Scaling and units mismatches: For example, W/m² vs kW/m², or a 4–20 mA range applied incorrectly.
- Point mapping errors: Wrong Modbus register, wrong data type (16-bit vs 32-bit), swapped words, incorrect signed/unsigned interpretation.
- Time sync problems: Data is “correct” but timestamped wrong, leading to bad comparisons and misleading alarms.
- Network reliability issues: Intermittent comms produce gaps that look like equipment underperformance.
- Sensor installation issues: Dirty domes, shading, misalignment, water ingress, or poor cable management.
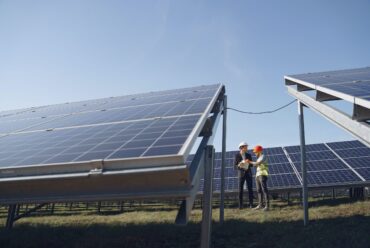
Commissioning-ready verification: how to validate signals end-to-end
Commissioning is the phase where you turn a sensor map and a network diagram into reliable operational reality. The goal is not only that points “show up,” but that they are correct, stable, and documented.
A practical end-to-end validation checklist
- Start at the sensor: Verify mounting, orientation, leveling, and basic sensor health. For irradiance sensors, confirm tilt matches POA design and that the sensor is not shaded.
- Validate wiring and input readings: Confirm the raw input at the datalogger/RTU (mV or mA) and verify it matches expected conditions.
- Confirm scaling once (and only once): Decide where scaling will live (device, gateway, or SCADA layer) and keep it consistent.
- Check device communications locally: Verify Modbus addressing, baud rate (for RTU), IP addressing (for TCP), and register mapping with a known-good test method.
- Validate network path and redundancy: Confirm routes, VLANs, and switch configurations match the design intent and do not overload polling performance.
- Confirm the point at the final destination: Verify the value, units, timestamp, and point naming in the SCADA/DAS UI and historian.
- Document everything: Capture as-built drawings, point lists, addressing plans, and test results so O&M can troubleshoot quickly after handoff.
Fiber and communications validation: why it matters for DAS uptime
On many utility-scale sites, fiber is the backbone of the DAS/SCADA network. A marginal termination or poorly documented splice may not fail immediately, but it can create intermittent issues that are painful to troubleshoot under operational pressure.
OTDR (Optical Time Domain Reflectometer) testing helps validate fiber integrity by identifying loss events, reflections, splices, bends, and breaks along a link. It also produces a baseline “trace” that can be used later to compare aging infrastructure and isolate faults.
In practice, teams often combine OTDR with insertion loss testing (commonly performed with an optical loss test set, OLTS) to confirm end-to-end link performance against project requirements.
Design decisions that affect the sensor map and data flow
Many commissioning delays can be traced back to early design assumptions. Here are the decisions that most often change the outcome.
DAS-only vs SCADA: what changes in the architecture?
- DAS emphasis: More focused on sensor quality, performance analytics, and reporting; fewer control pathways.
- SCADA emphasis: Adds control logic, utility interfaces, and often stricter requirements around alarm handling, cybersecurity, and documentation.
Even in a “DAS-only” scope, it’s smart to ensure the network and naming conventions won’t block future SCADA expansion.
How many MET stations and irradiance sensors do you need?
There’s no single number. Decision criteria typically include:
- Site footprint and topographic variability
- Soiling patterns and microclimates
- Contractual performance reporting needs and PR confidence
- How quickly you need to isolate underperformance to a section of the plant
Polling strategy and network load
More data is not always better if it overwhelms the network or creates unstable polling. For commissioning, prioritize critical points and alarms, then expand the dataset thoughtfully based on operational value.
Success metrics: how to know your DAS is “good” after COD
A strong solar data acquisition system should deliver measurable operational outcomes, not just a dashboard.
- Data completeness: Low rate of missing points and minimal comms gaps during production hours.
- Data correctness: Units, scaling, and timestamps are consistent and validated against known references.
- Troubleshootability: Clear point naming, clean as-builts, and baseline test records (including fiber test documentation) reduce mean time to repair (MTTR).
- COD readiness: Utility and contractual reporting requirements are met with clean documentation and repeatable tests.
Common pitfalls (and how to avoid them)
- Assuming “points showing up” means the system is correct: Always validate against a reference (handheld meter, known sensor output range, or cross-check with independent data).
- Under-documenting as-builts: A missing addressing plan or point list can cost far more later than it saves during construction.
- Inconsistent naming conventions: Naming should help humans troubleshoot quickly (device, location, signal, units) and remain stable across software migrations.
- Skipping fiber baselines: Without OTDR traces and loss results at turnover, later troubleshooting becomes guesswork.
Conclusion: build the sensor map, then prove the data flow
A utility-scale solar DAS succeeds when it captures the right measurements, transports them reliably, and presents them in a way that supports commissioning, performance analysis, and O&M—without mystery gaps or questionable values. The fastest path to that outcome is a clear sensor map plus disciplined end-to-end validation and documentation.
If you want a second set of eyes on a sensor map, network design, or commissioning plan—or you need field verification (including fiber testing and documentation)—REIG’s integration teams focus on making plant data dependable from day one and keeping it that way after COD.
FAQ
What is the difference between a solar DAS and SCADA?
A solar DAS focuses on monitoring and data collection—pulling measurements from sensors and devices so teams can view performance and trends. SCADA includes data acquisition but adds supervisory control functions, often required for utility interconnection and grid support. Many utility-scale projects use both, sharing sensors and communications while separating responsibilities (monitoring vs control).
Which sensors are most critical in a utility-scale solar data acquisition system?
Most sites start with irradiance (POA and/or GHI), ambient and module temperature, and plant-level electrical metering as a core set. Inverter status/power and key alarms are also essential for operations. Bifacial sites commonly add rear POA sensors to quantify back-side irradiance and improve performance analysis.
Why do commissioning teams still see bad data even when devices are online?
Online communications only confirms that something is talking—not that the value is correct. Common issues include wrong scaling, incorrect Modbus register mapping, swapped word order for 32-bit values, and inconsistent units. End-to-end validation should confirm raw input, scaling location, and final historian/UI values with timestamps.
How do OTDR tests help with solar DAS reliability?
OTDR testing characterizes fiber links by showing loss and reflection events along the cable, helping locate splices, bends, and faults. It also provides a baseline trace at turnover, which is valuable for later troubleshooting and warranty discussions. In many projects, OTDR is paired with insertion loss testing to confirm the link meets performance requirements.
What documentation should be included in a DAS handoff package?
At minimum, include as-built network drawings, IP/addressing plans, device lists, point lists/tag dictionaries, and a record of scaling and units. For communications infrastructure, include fiber test results (OTDR traces and loss results, as required) and clear labeling conventions. Good documentation reduces downtime by making future troubleshooting faster and less invasive.
Further reading
Solar Data Acquisition System (DAS): Sensor Map + Data Flow
A solar data acquisition system (DAS) is only “done” when the data is trustworthy end-to-end: sensors are installed correctly, signals are scaled properly, communications are reliable, and the final values show up in the right places for commissioning, performance analysis, and long-term operations.
This guide is for utility-scale solar owners/operators, EPCs, commissioning leads, and O&M teams who want a practical sensor map and a clear understanding of how data flows from the field into SCADA, dashboards, and reports—plus the validation steps that prevent the most common data-quality problems.
What a solar DAS is (and what it isn’t)
A Data Acquisition System (DAS) collects measurements from field devices (sensors, meters, inverters, trackers, weather stations) and stores and forwards them so people and software can visualize and analyze performance. It answers: “What is happening?”
SCADA (Supervisory Control and Data Acquisition) includes data acquisition but adds supervisory control and grid/utility-driven functions (for example, setpoints, curtailment, voltage/reactive power control, and interconnection requirements). It answers: “What is happening, and what do we need to control?”
In real projects, DAS and SCADA often share sensors, communications networks, and data pathways. The key is to define what must be available for COD, what is required by the utility, and what is needed for performance and O&M.
Sensor map: what to measure on a utility-scale solar site
The “right” sensor map depends on plant size, technology (fixed-tilt vs trackers, bifacial vs monofacial), interconnection requirements, and how the asset will be operated. But most sites share a core set of measurements.
1) Meteorological (MET) station and irradiance sensors
MET and irradiance measurements are foundational because they help separate “resource” from “equipment.” If energy is down, you need to know whether irradiance dropped or the plant underperformed.
- Pyranometer (GHI and/or POA): Measures solar irradiance in W/m². Commonly deployed as Global Horizontal Irradiance (GHI) and Plane of Array (POA). Some sites use multiple POA sensors across the array.
- Reference cell: A calibrated PV cell used as an irradiance reference that often tracks PV response more directly than a thermopile pyranometer in certain operating contexts. Commonly used for performance ratio (PR) and operational comparisons.
- Rear POA (RPOA) for bifacial: Measures irradiance on the back side to help quantify albedo and bifacial gain.
- Ambient temperature and module temperature: Important for expected power modeling and troubleshooting thermal derates.
- Wind speed/direction and other site-specific weather sensors (optional): Useful for thermal behavior, soiling correlations, and extreme weather awareness.
Placement and installation quality matter. A perfectly accurate sensor in the wrong location (or installed at the wrong tilt, poorly leveled, or dirty) produces misleading data.
2) Electrical production and revenue-grade metering
At minimum, you need values that reconcile with what matters financially and contractually.
- Revenue meter (as specified by the utility/market): Typically the settlement point for energy delivery.
- Plant-level and feeder-level meters (as designed): Used to understand losses, validate interconnection requirements, and isolate issues.
- Power quality measurements (where required): Depending on interconnection and compliance obligations.
3) Inverter and power conversion data
Inverter data is the heartbeat of day-to-day operations. Even if you don’t trend every possible point at high frequency, you need enough to identify failures, derates, and communications gaps quickly.
- AC power, energy counters, DC voltage/current (as available), and operating state
- Faults/alarms and key status bits
- Temperatures, internal diagnostics, and availability indicators (selectively trended)
4) Tracker and array controls (where applicable)
For single-axis tracking sites, tracker data can explain production deltas that look like “mystery” underperformance.
- Tracker position / stow status
- Tracker controller alarms, wind stow events
- Row or zone-level status (depending on architecture)
5) Substation and interconnection monitoring (SCADA-adjacent)
Even if your DAS scope is “monitoring only,” the site’s SCADA requirements are often driven by grid interconnection. Data points typically include substation breaker status, protective relay data, and utility interface signals as specified.
Quick reference: typical DAS sensor map
| Category | Common signals | Why it matters | Common failure modes |
|---|---|---|---|
| Resource (MET) | POA/GHI irradiance, ambient temp, module temp, wind | Separates “sun” from “system” and supports PR analysis | Dirty sensors, wrong tilt/level, bad scaling, wrong time sync |
| Electrical (plant) | Revenue meter, feeder meters, plant power/energy | Financial reconciliation and compliance reporting | Wrong CT/PT ratios, Modbus mapping errors, dropped comms |
| Inverters | Power, status, alarms, key diagnostics | Fast fault isolation and availability tracking | IP conflicts, wrong register maps, polling overload |
| Trackers | Position, stow, faults, comms health | Explains production deltas and mechanical/electrical issues | Addressing issues, gateway failures, inconsistent firmware maps |
| Network health | Switch ports, fiber links, gateway status (where available) | Reduces downtime by finding comms root cause faster | Bad terminations, high loss, water intrusion, misconfigured VLANs |
Data flow: from sensors to dashboards (what should happen)
Most “DAS problems” are really “data flow problems.” A signal can be correct at the sensor but wrong at the historian because scaling was applied twice, or because a gateway swapped byte order, or because the point name was mapped incorrectly.
Step-by-step data flow (typical architecture)
- Field measurement: A sensor (for example, pyranometer) produces an analog signal (mV or 4–20 mA) or digital output.
- Local signal conditioning and input: A datalogger, RTU, PLC, or remote I/O module reads the signal and applies scaling (engineering units like W/m² or °C).
- Protocol conversion / device communications: Field devices communicate via protocols such as Modbus RTU (serial) or Modbus TCP (Ethernet). Gateways may convert serial-to-Ethernet or normalize data.
- Site network transport: Managed switches, VLANs/subnets, and fiber or copper transport move data across the site LAN. For utility-scale sites, fiber is common for distance and noise immunity.
- SCADA/DAS server ingestion: A SCADA or DAS platform polls devices or subscribes to data, then stores values in a historian/database and makes them available to dashboards and reports.
- Visualization and reporting: Operators view dashboards, alarms, and trends; asset managers export data; performance engineers calculate PR and analyze losses.
Where data quality usually breaks down
- Scaling and units mismatches: For example, W/m² vs kW/m², or a 4–20 mA range applied incorrectly.
- Point mapping errors: Wrong Modbus register, wrong data type (16-bit vs 32-bit), swapped words, incorrect signed/unsigned interpretation.
- Time sync problems: Data is “correct” but timestamped wrong, leading to bad comparisons and misleading alarms.
- Network reliability issues: Intermittent comms produce gaps that look like equipment underperformance.
- Sensor installation issues: Dirty domes, shading, misalignment, water ingress, or poor cable management.
Commissioning-ready verification: how to validate signals end-to-end
Commissioning is the phase where you turn a sensor map and a network diagram into reliable operational reality. The goal is not only that points “show up,” but that they are correct, stable, and documented.
A practical end-to-end validation checklist
- Start at the sensor: Verify mounting, orientation, leveling, and basic sensor health. For irradiance sensors, confirm tilt matches POA design and that the sensor is not shaded.
- Validate wiring and input readings: Confirm the raw input at the datalogger/RTU (mV or mA) and verify it matches expected conditions.
- Confirm scaling once (and only once): Decide where scaling will live (device, gateway, or SCADA layer) and keep it consistent.
- Check device communications locally: Verify Modbus addressing, baud rate (for RTU), IP addressing (for TCP), and register mapping with a known-good test method.
- Validate network path and redundancy: Confirm routes, VLANs, and switch configurations match the design intent and do not overload polling performance.
- Confirm the point at the final destination: Verify the value, units, timestamp, and point naming in the SCADA/DAS UI and historian.
- Document everything: Capture as-built drawings, point lists, addressing plans, and test results so O&M can troubleshoot quickly after handoff.
Fiber and communications validation: why it matters for DAS uptime
On many utility-scale sites, fiber is the backbone of the DAS/SCADA network. A marginal termination or poorly documented splice may not fail immediately, but it can create intermittent issues that are painful to troubleshoot under operational pressure.
OTDR (Optical Time Domain Reflectometer) testing helps validate fiber integrity by identifying loss events, reflections, splices, bends, and breaks along a link. It also produces a baseline “trace” that can be used later to compare aging infrastructure and isolate faults.
In practice, teams often combine OTDR with insertion loss testing (commonly performed with an optical loss test set, OLTS) to confirm end-to-end link performance against project requirements.
Design decisions that affect the sensor map and data flow
Many commissioning delays can be traced back to early design assumptions. Here are the decisions that most often change the outcome.
DAS-only vs SCADA: what changes in the architecture?
- DAS emphasis: More focused on sensor quality, performance analytics, and reporting; fewer control pathways.
- SCADA emphasis: Adds control logic, utility interfaces, and often stricter requirements around alarm handling, cybersecurity, and documentation.
Even in a “DAS-only” scope, it’s smart to ensure the network and naming conventions won’t block future SCADA expansion.
How many MET stations and irradiance sensors do you need?
There’s no single number. Decision criteria typically include:
- Site footprint and topographic variability
- Soiling patterns and microclimates
- Contractual performance reporting needs and PR confidence
- How quickly you need to isolate underperformance to a section of the plant
Polling strategy and network load
More data is not always better if it overwhelms the network or creates unstable polling. For commissioning, prioritize critical points and alarms, then expand the dataset thoughtfully based on operational value.
Success metrics: how to know your DAS is “good” after COD
A strong solar data acquisition system should deliver measurable operational outcomes, not just a dashboard.
- Data completeness: Low rate of missing points and minimal comms gaps during production hours.
- Data correctness: Units, scaling, and timestamps are consistent and validated against known references.
- Troubleshootability: Clear point naming, clean as-builts, and baseline test records (including fiber test documentation) reduce mean time to repair (MTTR).
- COD readiness: Utility and contractual reporting requirements are met with clean documentation and repeatable tests.
Common pitfalls (and how to avoid them)
- Assuming “points showing up” means the system is correct: Always validate against a reference (handheld meter, known sensor output range, or cross-check with independent data).
- Under-documenting as-builts: A missing addressing plan or point list can cost far more later than it saves during construction.
- Inconsistent naming conventions: Naming should help humans troubleshoot quickly (device, location, signal, units) and remain stable across software migrations.
- Skipping fiber baselines: Without OTDR traces and loss results at turnover, later troubleshooting becomes guesswork.
Conclusion: build the sensor map, then prove the data flow
A utility-scale solar DAS succeeds when it captures the right measurements, transports them reliably, and presents them in a way that supports commissioning, performance analysis, and O&M—without mystery gaps or questionable values. The fastest path to that outcome is a clear sensor map plus disciplined end-to-end validation and documentation.
If you want a second set of eyes on a sensor map, network design, or commissioning plan—or you need field verification (including fiber testing and documentation)—REIG’s integration teams focus on making plant data dependable from day one and keeping it that way after COD.
FAQ
What is the difference between a solar DAS and SCADA?
A solar DAS focuses on monitoring and data collection—pulling measurements from sensors and devices so teams can view performance and trends. SCADA includes data acquisition but adds supervisory control functions, often required for utility interconnection and grid support. Many utility-scale projects use both, sharing sensors and communications while separating responsibilities (monitoring vs control).
Which sensors are most critical in a utility-scale solar data acquisition system?
Most sites start with irradiance (POA and/or GHI), ambient and module temperature, and plant-level electrical metering as a core set. Inverter status/power and key alarms are also essential for operations. Bifacial sites commonly add rear POA sensors to quantify back-side irradiance and improve performance analysis.
Why do commissioning teams still see bad data even when devices are online?
Online communications only confirms that something is talking—not that the value is correct. Common issues include wrong scaling, incorrect Modbus register mapping, swapped word order for 32-bit values, and inconsistent units. End-to-end validation should confirm raw input, scaling location, and final historian/UI values with timestamps.
How do OTDR tests help with solar DAS reliability?
OTDR testing characterizes fiber links by showing loss and reflection events along the cable, helping locate splices, bends, and faults. It also provides a baseline trace at turnover, which is valuable for later troubleshooting and warranty discussions. In many projects, OTDR is paired with insertion loss testing to confirm the link meets performance requirements.
What documentation should be included in a DAS handoff package?
At minimum, include as-built network drawings, IP/addressing plans, device lists, point lists/tag dictionaries, and a record of scaling and units. For communications infrastructure, include fiber test results (OTDR traces and loss results, as required) and clear labeling conventions. Good documentation reduces downtime by making future troubleshooting faster and less invasive.
Further reading
References
Next step
Need your solar data acquisition system validated end-to-end before COD (or cleaned up after turnover)? REIG can review your sensor map, confirm data flow from field devices to dashboards, and help deliver commissioning-ready documentation so your plant data is reliable from day one. Contact REIG to talk through your site and timeline.


